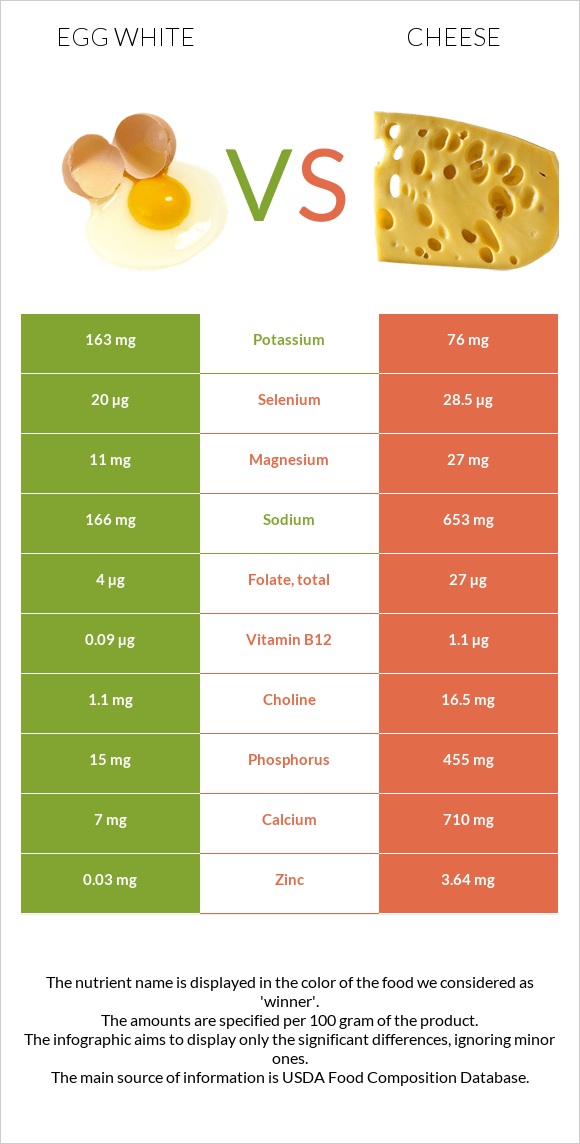
Summary of differences between egg whites and cheese Egg whites have less calcium, phosphorus, vitamin B12, zinc, vitamin A, selenium, and folate than cheese. Cheese covers your daily need for saturated fat, 94% more than egg whites. Egg whites have less sodium. These are the specific foods used in this comparison Egg, white, raw, fresh and Cheese, cheddar .
Infographic
Mineral Comparison
Mineral comparison score is based on the number of minerals by which one or the other food is richer. The "coverage" charts below show how much of the daily needs can be covered by 300 grams of the food.
2
100 g
300 g
1 large - 33g 1 cup - 243g
Magnesium
Magnesium
Calcium
Calcium
Potassium
Potassium
Iron
Iron
Copper
Copper
Zinc
Zinc
Phosphorus
Phosphorus
Sodium
Sodium
Manganese
Manganese
Selenium
Selenium
7.9%
2.1%
14%
3%
7.7%
0.82%
6.4%
22%
1.4%
109%
8
100 g
300 g
1 cubic inch - 17g 1 slice (1 oz) - 28g 1 oz - 28.35g 1 cup, shredded - 113g 1 cup, diced - 132g 1 cup, melted - 244g
Magnesium
Magnesium
Calcium
Calcium
Potassium
Potassium
Iron
Iron
Copper
Copper
Zinc
Zinc
Phosphorus
Phosphorus
Sodium
Sodium
Manganese
Manganese
Selenium
Selenium
19%
213%
6.7%
5.3%
10%
99%
195%
85%
3.5%
155%
Vitamin Comparison
Vitamin comparison score is based on the number of vitamins by which one or the other food is richer. The "coverage" charts below show how much of the daily needs can be covered by 300 grams of the food.
1
100 g
300 g
1 large - 33g 1 cup - 243g
Vitamin C
Vit. C
Vitamin D
Vit. D
Vitamin A
Vit. A
Vitamin E
Vit. E
Vitamin B1
Vit. B1
Vitamin B2
Vit. B2
Vitamin B3
Vit. B3
Vitamin B5
Vit. B5
Vitamin B6
Vit. B6
Vitamin B12
Vit. B12
Vitamin K
Vit. K
Folate
Folate
0%
0%
0%
0%
1%
101%
2%
11%
1.2%
11%
0%
3%
9
100 g
300 g
1 cubic inch - 17g 1 slice (1 oz) - 28g 1 oz - 28.35g 1 cup, shredded - 113g 1 cup, diced - 132g 1 cup, melted - 244g
Vitamin C
Vit. C
Vitamin D
Vit. D
Vitamin A
Vit. A
Vitamin E
Vit. E
Vitamin B1
Vit. B1
Vitamin B2
Vit. B2
Vitamin B3
Vit. B3
Vitamin B5
Vit. B5
Vitamin B6
Vit. B6
Vitamin B12
Vit. B12
Vitamin K
Vit. K
Folate
Folate
0%
9%
110%
14%
7.3%
99%
1.1%
25%
15%
138%
6%
20%
All nutrients comparison - raw data values
Nutrient
DV% diff.
Saturated fat
0g
18.867g
86%
Calcium
7mg
710mg
70%
Phosphorus
15mg
455mg
63%
Fats
0.17g
33.31g
51%
Vitamin B12
0.09µg
1.1µg
42%
Vitamin A
0µg
330µg
37%
Cholesterol
0mg
99mg
33%
Zinc
0.03mg
3.64mg
33%
Protein
10.9g
22.87g
24%
Monounsaturated fat
0g
9.246g
23%
Sodium
166mg
653mg
21%
Calories
52kcal
404kcal
18%
Selenium
20µg
28.5µg
15%
Polyunsaturated fat
0g
1.421g
9%
Folate
4µg
27µg
6%
Vitamin E
0mg
0.71mg
5%
Vitamin B6
0.005mg
0.066mg
5%
Magnesium
11mg
27mg
4%
Vitamin B5
0.19mg
0.41mg
4%
Vitamin D*
0 IU
24 IU
3%
Vitamin D
0µg
0.6µg
3%
Potassium
163mg
76mg
3%
Choline
1.1mg
16.5mg
3%
Vitamin B1
0.004mg
0.029mg
2%
Vitamin K
0µg
2.4µg
2%
Carbs
0.73g
3.09g
1%
Iron
0.08mg
0.14mg
1%
Copper
0.023mg
0.03mg
1%
Manganese
0.011mg
0.027mg
1%
Vitamin B2
0.439mg
0.428mg
1%
Protein per 100 calories
21g
5.7g
N/A
Calories per 10 g protein
48kcal
177kcal
N/A
Weight per 100 calories
192g
25g
N/A
Unsaturated / Saturated Fat ratio
0.57
N/A
Net carbs
0.73g
3.09g
N/A
Sugar
0.71g
0.48g
N/A
Vitamin B3
0.105mg
0.059mg
0%
Trans fat
0.917g
N/A
Tryptophan
0.125mg
0.547mg
0%
Threonine
0.449mg
1.044mg
0%
Isoleucine
0.661mg
1.206mg
0%
Leucine
1.016mg
1.939mg
0%
Lysine
0.806mg
1.025mg
0%
Methionine
0.399mg
0.547mg
0%
Phenylalanine
0.686mg
1.074mg
0%
Valine
0.809mg
1.404mg
0%
Histidine
0.29mg
0.547mg
0%
Fructose
0.07g
0g
0%
Omega-3 - EPA
0g
0.01g
N/A
Omega-3 - DHA
0g
0.001g
N/A
Omega-3 - DPA
0g
0.017g
N/A
Omega-6 - Eicosadienoic acid
0.007g
N/A
Macronutrient Comparison
Macronutrient breakdown side-by-side comparison
1
11%
88%
Protein:
10.9 g
Fats:
0.17 g
Carbs:
0.73 g
Water:
87.57 g
Other:
0.63 g
4
23%
33%
3%
37%
4%
Protein:
22.87 g
Fats:
33.31 g
Carbs:
3.09 g
Water:
37.02 g
Other:
3.71 g
Contains
more
Water Water
+136.5%
Contains
more
Protein Protein
+109.8%
Contains
more
Fats Fats
+19494.1%
Contains
more
Carbs Carbs
+323.3%
Contains
more
Other Other
+488.9%
Carbohydrate type comparison
Carbohydrate type breakdown side-by-side comparison
4
10%
49%
10%
10%
10%
10%
Starch:
0 g
Sucrose:
0.07 g
Glucose:
0.34 g
Fructose:
0.07 g
Lactose:
0.07 g
Maltose:
0.07 g
Galactose:
0.07 g
2
54%
25%
21%
Starch:
0 g
Sucrose:
0 g
Glucose:
0.26 g
Fructose:
0 g
Lactose:
0.12 g
Maltose:
0 g
Galactose:
0.1 g
Contains
more
Sucrose Sucrose
+∞%
Contains
more
Glucose Glucose
+30.8%
Contains
more
Fructose Fructose
+∞%
Contains
more
Maltose Maltose
+∞%
Contains
more
Lactose Lactose
+71.4%
Contains
more
Galactose Galactose
+42.9%