English muffins, plain, enriched, with ca prop (includes sourdough) vs. Dinner rolls — In-Depth Nutrition Comparison
Compare
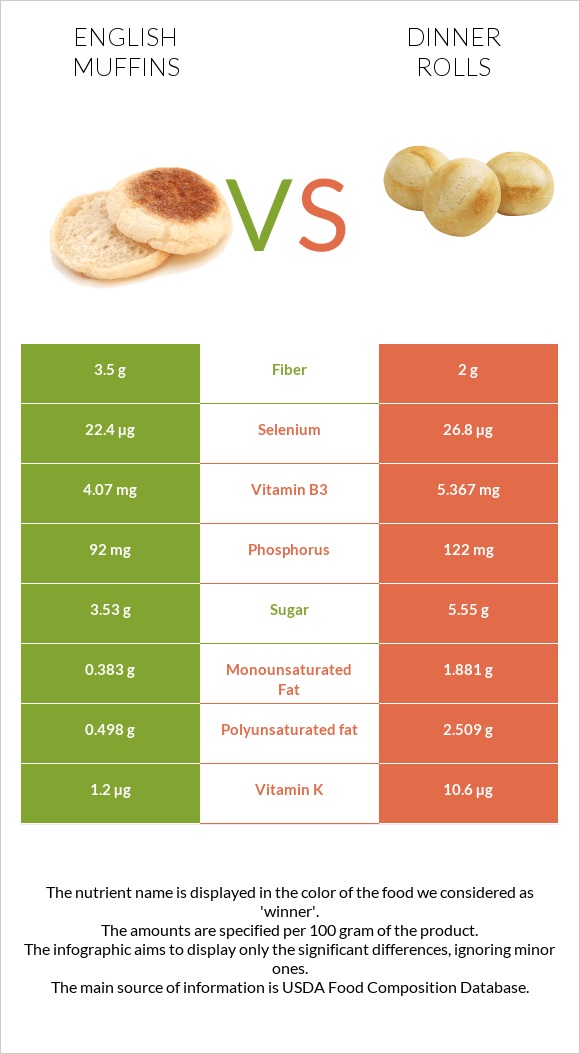
Significant differences between english muffins, plain, enriched, with ca prop (includes sourdough) and dinner rolls
- English muffins, plain, enriched, with ca prop (includes sourdough) have more fiber; however, dinner rolls are richer in vitamin B2, vitamin B3, selenium, vitamin K, monounsaturated fat, and polyunsaturated fat.
- Dinner rolls have 2 times less fiber than english muffins, plain, enriched, with ca prop (includes sourdough). English muffins, plain, enriched, with ca prop (includes sourdough) have 3.5g of fiber, while dinner rolls have 2g.
- English muffins, plain, enriched, with ca prop (includes sourdough) contain less sugar.
- Dinner rolls have a higher glycemic index. The glycemic index of dinner rolls is 62, while the glycemic index of english muffins, plain, enriched, with ca prop (includes sourdough) is 45.
Specific food types used in this comparison are English muffins, plain, enriched, with ca prop (includes sourdough) and Rolls, dinner, plain, commercially prepared (includes brown-and-serve).
Infographic
Infographic link
Mineral Comparison
Mineral comparison score is based on the number of minerals by which one or the other food is richer. The "coverage" charts below show how much of the daily needs can be covered by 300 grams of the food.
| Contains more PotassiumPotassium | +27.5% |
| Contains more PhosphorusPhosphorus | +32.6% |
| Contains more ManganeseManganese | +15.2% |
| Contains more SeleniumSelenium | +19.6% |
Vitamin Comparison
Vitamin comparison score is based on the number of vitamins by which one or the other food is richer. The "coverage" charts below show how much of the daily needs can be covered by 300 grams of the food.
| Contains more Vitamin CVitamin C | +800% |
| Contains more Vitamin AVitamin A | +∞% |
| Contains more Vitamin B1Vitamin B1 | +10.3% |
| Contains more Vitamin B2Vitamin B2 | +49.6% |
| Contains more Vitamin B3Vitamin B3 | +31.9% |
| Contains more Vitamin B5Vitamin B5 | +24.5% |
| Contains more Vitamin B6Vitamin B6 | +79.6% |
| Contains more Vitamin B12Vitamin B12 | +225% |
| Contains more Vitamin KVitamin K | +783.3% |
All nutrients comparison - raw data values
| Nutrient |  |
 |
DV% diff. |
| Starch | 37.2g | 15% | |
| Methionine | 153mg | 0.145mg | 15% |
| Polyunsaturated fat | 0.498g | 2.509g | 13% |
| Vitamin B2 | 0.25mg | 0.374mg | 10% |
| Vitamin K | 1.2µg | 10.6µg | 8% |
| Vitamin B3 | 4.07mg | 5.367mg | 8% |
| Selenium | 22.4µg | 26.8µg | 8% |
| Fats | 1.69g | 6.47g | 7% |
| Fiber | 3.5g | 2g | 6% |
| Monounsaturated fat | 0.383g | 1.881g | 4% |
| Vitamin B12 | 0.04µg | 0.13µg | 4% |
| Protein | 8.87g | 10.86g | 4% |
| Vitamin B1 | 0.477mg | 0.526mg | 4% |
| Phosphorus | 92mg | 122mg | 4% |
| Calories | 227kcal | 310kcal | 4% |
| Iron | 4mg | 3.72mg | 4% |
| Vitamin B6 | 0.054mg | 0.097mg | 3% |
| Carbs | 44.17g | 52.04g | 3% |
| Saturated fat | 0.733g | 1.375g | 3% |
| Manganese | 0.505mg | 0.582mg | 3% |
| Vitamin B5 | 0.363mg | 0.452mg | 2% |
| Sodium | 425mg | 467mg | 2% |
| Folate | 94µg | 101µg | 2% |
| Calcium | 163mg | 178mg | 2% |
| Vitamin C | 1.8mg | 0.2mg | 2% |
| Cholesterol | 0mg | 4mg | 1% |
| Zinc | 1.05mg | 0.99mg | 1% |
| Potassium | 109mg | 139mg | 1% |
| Fructose | 0.69g | 1% | |
| Net carbs | 40.67g | 50.04g | N/A |
| Magnesium | 24mg | 26mg | 0% |
| Sugar | 3.53g | 5.55g | N/A |
| Copper | 0.135mg | 0.135mg | 0% |
| Vitamin E | 0.31mg | 0.28mg | 0% |
| Vitamin A | 0µg | 1µg | 0% |
| Choline | 16mg | 14.6mg | 0% |
| Tryptophan | 0.108mg | 0.081mg | 0% |
| Threonine | 0.331mg | 0.286mg | 0% |
| Isoleucine | 0.404mg | 0.337mg | 0% |
| Leucine | 0.652mg | 0.729mg | 0% |
| Lysine | 0.45mg | 0.233mg | 0% |
| Phenylalanine | 0.417mg | 0.506mg | 0% |
| Valine | 0.454mg | 0.401mg | 0% |
| Histidine | 0.201mg | 0.222mg | 0% |
| Omega-3 - DHA | 0g | 0.001g | N/A |
| Omega-3 - ALA | 0.048g | 0.224g | N/A |
Macronutrient Comparison
Macronutrient breakdown side-by-side comparison
Protein:
8.87 g
Fats:
1.69 g
Carbs:
44.17 g
Water:
43.56 g
Other:
1.71 g
Protein:
10.86 g
Fats:
6.47 g
Carbs:
52.04 g
Water:
28.44 g
Other:
2.19 g
| Contains more WaterWater | +53.2% |
| Contains more ProteinProtein | +22.4% |
| Contains more FatsFats | +282.8% |
| Contains more CarbsCarbs | +17.8% |
| Contains more OtherOther | +28.1% |
Fat Type Comparison
Fat type breakdown side-by-side comparison
Saturated fat:
Sat. Fat
0.733 g
Monounsaturated fat:
Mono. Fat
0.383 g
Polyunsaturated fat:
Poly. Fat
0.498 g
Saturated fat:
Sat. Fat
1.375 g
Monounsaturated fat:
Mono. Fat
1.881 g
Polyunsaturated fat:
Poly. Fat
2.509 g
| Contains less Sat. FatSaturated fat | -46.7% |
| Contains more Mono. FatMonounsaturated fat | +391.1% |
| Contains more Poly. FatPolyunsaturated fat | +403.8% |