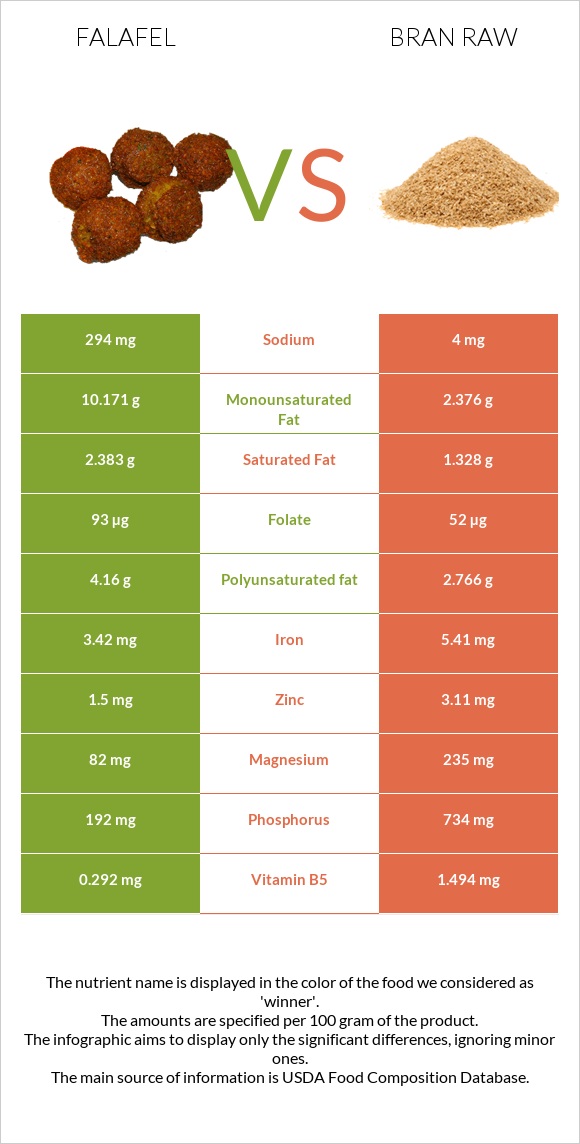
Differences between falafel and bran raw Falafel contains less manganese, vitamin B1, selenium, phosphorus, magnesium, iron, vitamin B5, copper, and zinc than bran raw. Bran raw's daily need coverage for manganese is 215% higher. Bran raw contains 74 times less sodium than falafel. Falafel contains 294mg of sodium, while bran raw contains 4mg. Falafel has a lower glycemic index. The glycemic index of falafel is 33, while the glycemic index of bran raw is 56. The food types used in this comparison are Falafel, home-prepared and Oat bran, raw .
Infographic
Mineral Comparison
Mineral comparison score is based on the number of minerals by which one or the other food is richer. The "coverage" charts below show how much of the daily needs can be covered by 300 grams of the food.
0
100 g
300 g
1 patty (approx 2-1/4" dia) - 17g
Magnesium
Magnesium
Calcium
Calcium
Potassium
Potassium
Iron
Iron
Copper
Copper
Zinc
Zinc
Phosphorus
Phosphorus
Sodium
Sodium
Manganese
Manganese
Selenium
Selenium
59%
16%
52%
128%
86%
41%
82%
38%
90%
5.5%
8
100 g
300 g
1 cup - 94g
Magnesium
Magnesium
Calcium
Calcium
Potassium
Potassium
Iron
Iron
Copper
Copper
Zinc
Zinc
Phosphorus
Phosphorus
Sodium
Sodium
Manganese
Manganese
Selenium
Selenium
168%
17%
50%
203%
134%
85%
315%
0.52%
734%
247%
Vitamin Comparison
Vitamin comparison score is based on the number of vitamins by which one or the other food is richer. The "coverage" charts below show how much of the daily needs can be covered by 300 grams of the food.
4
100 g
300 g
1 patty (approx 2-1/4" dia) - 17g
Vitamin C
Vit. C
Vitamin D
Vit. D
Vitamin A
Vit. A
Vitamin E
Vit. E
Vitamin B1
Vit. B1
Vitamin B2
Vit. B2
Vitamin B3
Vit. B3
Vitamin B5
Vit. B5
Vitamin B6
Vit. B6
Vitamin B12
Vit. B12
Vitamin K
Vit. K
Folate
Folate
5.3%
0%
0.33%
0%
37%
38%
20%
18%
29%
0%
0%
70%
6
100 g
300 g
1 cup - 94g
Vitamin C
Vit. C
Vitamin D
Vit. D
Vitamin A
Vit. A
Vitamin E
Vit. E
Vitamin B1
Vit. B1
Vitamin B2
Vit. B2
Vitamin B3
Vit. B3
Vitamin B5
Vit. B5
Vitamin B6
Vit. B6
Vitamin B12
Vit. B12
Vitamin K
Vit. K
Folate
Folate
0%
0%
0%
20%
293%
51%
18%
90%
38%
0%
8%
39%
All nutrients comparison - raw data values
Nutrient
DV% diff.
Manganese
0.691mg
5.63mg
215%
Vitamin B1
0.146mg
1.17mg
85%
Selenium
1µg
45.2µg
80%
Phosphorus
192mg
734mg
77%
Fiber
15.4g
62%
Magnesium
82mg
235mg
36%
Iron
3.42mg
5.41mg
25%
Vitamin B5
0.292mg
1.494mg
24%
Monounsaturated fat
10.171g
2.376g
19%
Fats
17.8g
7.03g
17%
Copper
0.258mg
0.403mg
16%
Zinc
1.5mg
3.11mg
15%
Sodium
294mg
4mg
13%
Carbs
31.84g
66.22g
11%
Folate
93µg
52µg
10%
Polyunsaturated fat
4.16g
2.766g
9%
Protein
13.31g
17.3g
8%
Vitamin E
1.01mg
7%
Choline
32.2mg
6%
Saturated fat
2.383g
1.328g
5%
Calories
333kcal
246kcal
4%
Vitamin B2
0.166mg
0.22mg
4%
Vitamin B6
0.125mg
0.165mg
3%
Vitamin K
3.2µg
3%
Vitamin C
1.6mg
0mg
2%
Potassium
585mg
566mg
1%
Vitamin B3
1.044mg
0.934mg
1%
Protein per 100 calories
4g
7g
N/A
Calories per 10 g protein
250kcal
142kcal
N/A
Weight per 100 calories
30g
41g
N/A
Unsaturated / Saturated Fat ratio
6
3.9
N/A
Net carbs
31.84g
50.82g
N/A
Calcium
54mg
58mg
0%
Sugar
1.45g
N/A
Vitamin A
1µg
0µg
0%
Tryptophan
0.134mg
0.335mg
0%
Threonine
0.492mg
0.502mg
0%
Isoleucine
0.567mg
0.668mg
0%
Leucine
0.944mg
1.374mg
0%
Lysine
0.856mg
0.76mg
0%
Methionine
0.187mg
0.335mg
0%
Phenylalanine
0.707mg
0.908mg
0%
Valine
0.562mg
0.964mg
0%
Histidine
0.364mg
0.41mg
0%
Macronutrient Comparison
Macronutrient breakdown side-by-side comparison
2
13%
18%
32%
35%
2%
Protein:
13.31 g
Fats:
17.8 g
Carbs:
31.84 g
Water:
34.62 g
Other:
2.43 g
3
17%
7%
66%
7%
3%
Protein:
17.3 g
Fats:
7.03 g
Carbs:
66.22 g
Water:
6.55 g
Other:
2.9 g
Contains
more
Fats Fats
+153.2%
Contains
more
Water Water
+428.5%
Contains
more
Protein Protein
+30%
Contains
more
Carbs Carbs
+108%
Contains
more
Other Other
+19.3%
Fat Type Comparison
Fat type breakdown side-by-side comparison
2
14%
61%
25%
Saturated fat:
Sat. Fat
2.383 g
Monounsaturated fat:
Mono. Fat
10.171 g
Polyunsaturated fat:
Poly. Fat
4.16 g
1
21%
37%
43%
Saturated fat:
Sat. Fat
1.328 g
Monounsaturated fat:
Mono. Fat
2.376 g
Polyunsaturated fat:
Poly. Fat
2.766 g
Contains
more
Mono. Fat Monounsaturated fat
+328.1%
Contains
more
Poly. Fat Polyunsaturated fat
+50.4%
Contains
less
Sat. Fat Saturated fat
-44.3%