Fat, mutton tallow vs. Olive oil — In-Depth Nutrition Comparison
Compare
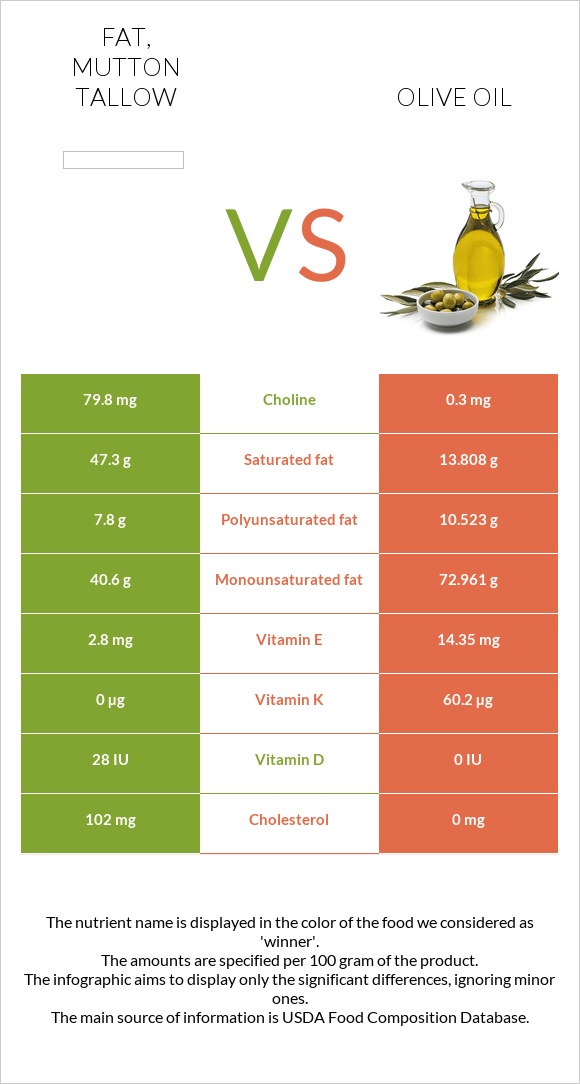
Summary of differences between fat, mutton tallow and olive oil
- Fat, mutton tallow has more choline, while olive oil has more vitamin E, vitamin K, iron, monounsaturated fat, and polyunsaturated fat.
- Fat, mutton tallow covers your daily need for saturated fat, 167% more than olive oil.
These are the specific foods used in this comparison Fat, mutton tallow and Oil, olive, salad or cooking.
Infographic
Infographic link
Mineral Comparison
Mineral comparison score is based on the number of minerals by which one or the other food is richer. The "coverage" charts below show how much of the daily needs can be covered by 300 grams of the food.
| Contains less SodiumSodium | -100% |
| Contains more SeleniumSelenium | +∞% |
| Contains more CalciumCalcium | +∞% |
| Contains more PotassiumPotassium | +∞% |
| Contains more IronIron | +∞% |
Vitamin Comparison
Vitamin comparison score is based on the number of vitamins by which one or the other food is richer. The "coverage" charts below show how much of the daily needs can be covered by 300 grams of the food.
| Contains more Vitamin DVitamin D | +∞% |
| Contains more Vitamin EVitamin E | +412.5% |
| Contains more Vitamin KVitamin K | +∞% |
All nutrients comparison - raw data values
| Nutrient |  |
 |
DV% diff. |
| Saturated fat | 47.3g | 13.808g | 152% |
| Monounsaturated fat | 40.6g | 72.961g | 81% |
| Vitamin E | 2.8mg | 14.35mg | 77% |
| Vitamin K | 0µg | 60.2µg | 50% |
| Cholesterol | 102mg | 0mg | 34% |
| Polyunsaturated fat | 7.8g | 10.523g | 18% |
| Choline | 79.8mg | 0.3mg | 14% |
| Iron | 0mg | 0.56mg | 7% |
| Vitamin D* | 28 IU | 0 IU | 4% |
| Vitamin D | 0.7µg | 0µg | 4% |
| Calories | 902kcal | 884kcal | 1% |
| Weight per 100 calories | 11g | 11g | N/A |
| Fats | 100g | 100g | 0% |
| Unsaturated / Saturated Fat ratio | 1 | 6 | N/A |
| Calcium | 0mg | 1mg | 0% |
| Potassium | 0mg | 1mg | 0% |
| Sodium | 0mg | 2mg | 0% |
| Selenium | 0.2µg | 0µg | 0% |
Macronutrient Comparison
Macronutrient breakdown side-by-side comparison
Protein:
0 g
Fats:
100 g
Carbs:
0 g
Water:
0 g
Other:
0 g
Protein:
0 g
Fats:
100 g
Carbs:
0 g
Water:
0 g
Other:
0 g
~equal in
Protein
~0g
~equal in
Fats
~100g
~equal in
Carbs
~0g
~equal in
Water
~0g
~equal in
Other
~0g
Fat Type Comparison
Fat type breakdown side-by-side comparison
Saturated fat:
Sat. Fat
47.3 g
Monounsaturated fat:
Mono. Fat
40.6 g
Polyunsaturated fat:
Poly. Fat
7.8 g
Saturated fat:
Sat. Fat
13.808 g
Monounsaturated fat:
Mono. Fat
72.961 g
Polyunsaturated fat:
Poly. Fat
10.523 g
| Contains less Sat. FatSaturated fat | -70.8% |
| Contains more Mono. FatMonounsaturated fat | +79.7% |
| Contains more Poly. FatPolyunsaturated fat | +34.9% |


