Fiddlehead ferns vs. Yardlong beans — In-Depth Nutrition Comparison
Compare
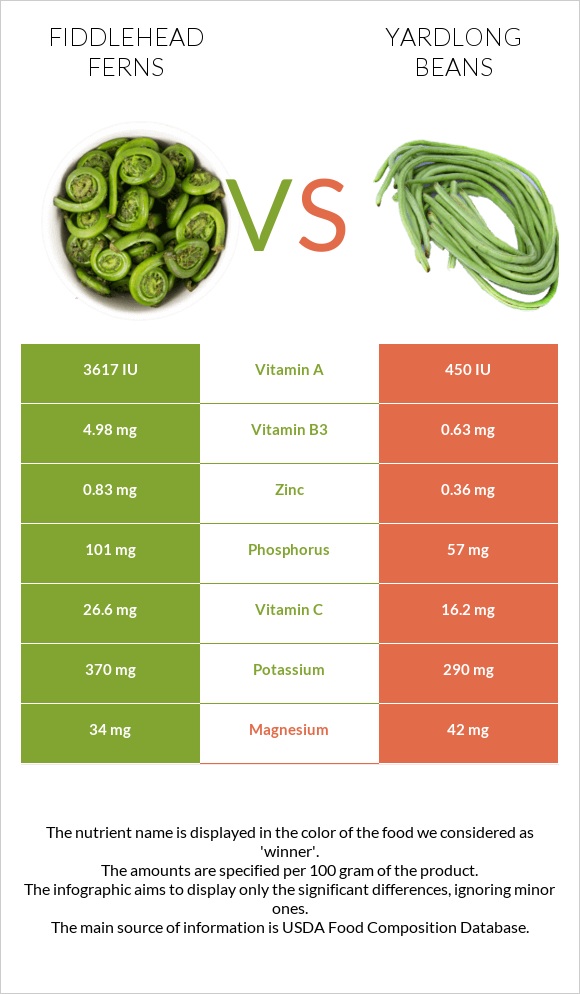
A recap on the differences between fiddlehead ferns and yardlong beans
- Fiddlehead ferns have more vitamin A, copper, vitamin B3, manganese, vitamin C, vitamin B2, and phosphorus; however, yardlong beans is higher in vitamin B1.
- Fiddlehead ferns cover your daily vitamin A needs 63% more than yardlong beans.
- Yardlong beans contains 8 times less vitamin B3 than fiddlehead ferns. Fiddlehead ferns contain 4.98mg of vitamin B3, while yardlong beans contains 0.63mg.
Food varieties used in this article are Fiddlehead ferns, raw and Yardlong bean, cooked, boiled, drained, without salt.
Infographic
Infographic link
Mineral Comparison
Mineral comparison score is based on the number of minerals by which one or the other food is richer. The "coverage" charts below show how much of the daily needs can be covered by 300 grams of the food.
| Contains more PotassiumPotassium | +27.6% |
| Contains more IronIron | +33.7% |
| Contains more CopperCopper | +580.9% |
| Contains more ZincZinc | +130.6% |
| Contains more PhosphorusPhosphorus | +77.2% |
| Contains less SodiumSodium | -75% |
| Contains more ManganeseManganese | +153.7% |
| Contains more MagnesiumMagnesium | +23.5% |
| Contains more CalciumCalcium | +37.5% |
Vitamin Comparison
Vitamin comparison score is based on the number of vitamins by which one or the other food is richer. The "coverage" charts below show how much of the daily needs can be covered by 300 grams of the food.
| Contains more Vitamin CVitamin C | +64.2% |
| Contains more Vitamin AVitamin A | +687% |
| Contains more Vitamin B2Vitamin B2 | +112.1% |
| Contains more Vitamin B3Vitamin B3 | +690.5% |
| Contains more Vitamin B1Vitamin B1 | +325% |
All nutrients comparison - raw data values
| Nutrient |  |
 |
DV% diff. |
| Copper | 0.32mg | 0.047mg | 30% |
| Vitamin B3 | 4.98mg | 0.63mg | 27% |
| Vitamin A | 181µg | 23µg | 18% |
| Manganese | 0.51mg | 0.201mg | 13% |
| Vitamin C | 26.6mg | 16.2mg | 12% |
| Folate | 45µg | 11% | |
| Vitamin B2 | 0.21mg | 0.099mg | 9% |
| Phosphorus | 101mg | 57mg | 6% |
| Vitamin B1 | 0.02mg | 0.085mg | 5% |
| Protein | 4.55g | 2.53g | 4% |
| Iron | 1.31mg | 0.98mg | 4% |
| Zinc | 0.83mg | 0.36mg | 4% |
| Selenium | 1.5µg | 3% | |
| Magnesium | 34mg | 42mg | 2% |
| Potassium | 370mg | 290mg | 2% |
| Vitamin B6 | 0.024mg | 2% | |
| Calories | 34kcal | 47kcal | 1% |
| Carbs | 5.54g | 9.18g | 1% |
| Calcium | 32mg | 44mg | 1% |
| Vitamin B5 | 0.051mg | 1% | |
| Protein per 100 calories | 13g | 5.4g | N/A |
| Calories per 10 g protein | 75kcal | 186kcal | N/A |
| Weight per 100 calories | 294g | 213g | N/A |
| Fats | 0.4g | 0.1g | 0% |
| Net carbs | 5.54g | 9.18g | N/A |
| Sodium | 1mg | 4mg | 0% |
| Saturated fat | 0.026g | 0% | |
| Monounsaturated fat | 0.009g | 0% | |
| Polyunsaturated fat | 0.042g | 0% | |
| Tryptophan | 0.029mg | 0% | |
| Threonine | 0.094mg | 0% | |
| Isoleucine | 0.135mg | 0% | |
| Leucine | 0.18mg | 0% | |
| Lysine | 0.166mg | 0% | |
| Methionine | 0.036mg | 0% | |
| Phenylalanine | 0.139mg | 0% | |
| Valine | 0.146mg | 0% | |
| Histidine | 0.082mg | 0% |
Macronutrient Comparison
Macronutrient breakdown side-by-side comparison
Protein:
4.55 g
Fats:
0.4 g
Carbs:
5.54 g
Water:
88.68 g
Other:
0.83 g
Protein:
2.53 g
Fats:
0.1 g
Carbs:
9.18 g
Water:
87.47 g
Other:
0.72 g
| Contains more ProteinProtein | +79.8% |
| Contains more FatsFats | +300% |
| Contains more OtherOther | +15.3% |
| Contains more CarbsCarbs | +65.7% |
~equal in
Water
~87.47g


