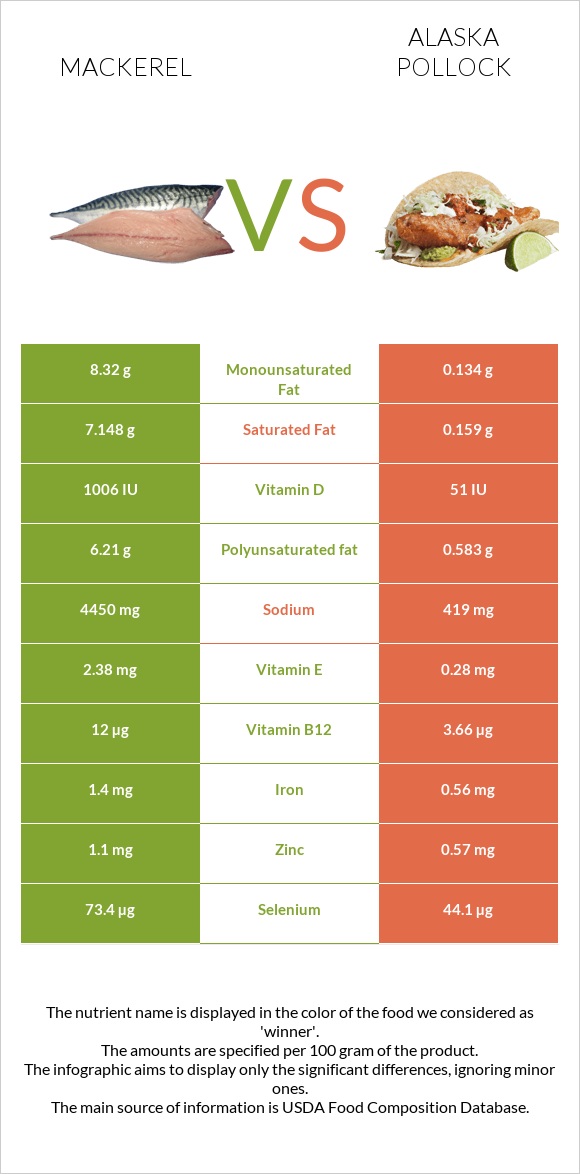
What are the differences between mackerel and pollock? Mackerel is richer than pollock in vitamin B12, vitamin D*, selenium, vitamin E, iron, vitamin K, and vitamin B6. Mackerel's daily need coverage for vitamin B12 is 348% more. Mackerel has 78 times more vitamin K than pollock. While mackerel has 7.8µg of vitamin K, pollock has only 0.1µg. The amount of saturated fat in pollock is lower. We used Fish, mackerel, salted and Fish, pollock, Alaska, cooked, dry heat (may have been previously frozen) types in this article.
Infographic
Mineral Comparison
Mineral comparison score is based on the number of minerals by which one or the other food is richer. The "coverage" charts below show how much of the daily needs can be covered by 300 grams of the food.
5
100 g
300 g
1 cubic inch, boneless - 17g 1 piece (5-1/2" x 1-1/2" x 1/2") - 80g 1 cup, cooked - 136g
Magnesium
Magnesium
Calcium
Calcium
Potassium
Potassium
Iron
Iron
Copper
Copper
Zinc
Zinc
Phosphorus
Phosphorus
Sodium
Sodium
Manganese
Manganese
Selenium
Selenium
43%
20%
46%
53%
33%
30%
109%
580%
0%
400%
3
100 g
300 g
1 fillet - 60g 3 oz - 85g
Magnesium
Magnesium
Calcium
Calcium
Potassium
Potassium
Iron
Iron
Copper
Copper
Zinc
Zinc
Phosphorus
Phosphorus
Sodium
Sodium
Manganese
Manganese
Selenium
Selenium
58%
22%
38%
21%
20%
16%
114%
55%
2.3%
241%
Vitamin Comparison
Vitamin comparison score is based on the number of vitamins by which one or the other food is richer. The "coverage" charts below show how much of the daily needs can be covered by 300 grams of the food.
7
100 g
300 g
1 cubic inch, boneless - 17g 1 piece (5-1/2" x 1-1/2" x 1/2") - 80g 1 cup, cooked - 136g
Vitamin C
Vit. C
Vitamin D
Vit. D
Vitamin A
Vit. A
Vitamin E
Vit. E
Vitamin B1
Vit. B1
Vitamin B2
Vit. B2
Vitamin B3
Vit. B3
Vitamin B5
Vit. B5
Vitamin B6
Vit. B6
Vitamin B12
Vit. B12
Vitamin K
Vit. K
Folate
Folate
0%
378%
16%
48%
5%
44%
62%
0%
95%
1500%
20%
11%
4
100 g
300 g
1 fillet - 60g 3 oz - 85g
Vitamin C
Vit. C
Vitamin D
Vit. D
Vitamin A
Vit. A
Vitamin E
Vit. E
Vitamin B1
Vit. B1
Vitamin B2
Vit. B2
Vitamin B3
Vit. B3
Vitamin B5
Vit. B5
Vitamin B6
Vit. B6
Vitamin B12
Vit. B12
Vitamin K
Vit. K
Folate
Folate
0%
20%
5.7%
5.6%
14%
51%
74%
26%
76%
458%
0.25%
2.3%
All nutrients comparison - raw data values
Nutrient
DV% diff.
Vitamin B12
12µg
3.66µg
348%
Sodium
4450mg
419mg
175%
Vitamin D
25.2µg
1.3µg
120%
Vitamin D*
1006 IU
51 IU
119%
Selenium
73.4µg
44.1µg
53%
Polyunsaturated fat
6.21g
0.583g
38%
Fats
25.1g
1.18g
37%
Saturated fat
7.148g
0.159g
32%
Monounsaturated fat
8.32g
0.134g
20%
Vitamin E
2.38mg
0.28mg
14%
Iron
1.4mg
0.56mg
11%
Calories
305kcal
111kcal
10%
Protein
18.5g
23.48g
10%
Vitamin B5
0.432mg
9%
Vitamin B6
0.41mg
0.329mg
6%
Vitamin K
7.8µg
0.1µg
6%
Magnesium
60mg
81mg
5%
Zinc
1.1mg
0.57mg
5%
Copper
0.1mg
0.06mg
4%
Vitamin B3
3.3mg
3.949mg
4%
Cholesterol
95mg
86mg
3%
Potassium
520mg
430mg
3%
Vitamin A
47µg
17µg
3%
Vitamin B1
0.02mg
0.054mg
3%
Vitamin B2
0.19mg
0.223mg
3%
Folate
15µg
3µg
3%
Phosphorus
254mg
267mg
2%
Choline
101.6mg
91.6mg
2%
Calcium
66mg
72mg
1%
Manganese
0.018mg
1%
Protein per 100 calories
6.1g
21g
N/A
Calories per 10 g protein
165kcal
47kcal
N/A
Weight per 100 calories
33g
90g
N/A
Unsaturated / Saturated Fat ratio
2
4.5
N/A
Tryptophan
0.263mg
0%
Threonine
1.029mg
0%
Isoleucine
1.082mg
0%
Leucine
1.908mg
0%
Lysine
2.157mg
0%
Methionine
0.696mg
0%
Phenylalanine
0.917mg
0%
Valine
1.21mg
0%
Histidine
0.691mg
0%
Omega-3 - EPA
1.619g
0.086g
N/A
Omega-3 - DHA
2.965g
0.423g
N/A
Omega-3 - DPA
0.391g
0.027g
N/A
Macronutrient Comparison
Macronutrient breakdown side-by-side comparison
2
19%
25%
43%
13%
Protein:
18.5 g
Fats:
25.1 g
Carbs:
0 g
Water:
43 g
Other:
13.4 g
2
23%
74%
2%
Protein:
23.48 g
Fats:
1.18 g
Carbs:
0 g
Water:
73.65 g
Other:
1.69 g
Contains
more
Fats Fats
+2027.1%
Contains
more
Other Other
+692.9%
Contains
more
Protein Protein
+26.9%
Contains
more
Water Water
+71.3%
Fat Type Comparison
Fat type breakdown side-by-side comparison
2
33%
38%
29%
Saturated fat:
Sat. Fat
7.148 g
Monounsaturated fat:
Mono. Fat
8.32 g
Polyunsaturated fat:
Poly. Fat
6.21 g
1
18%
15%
67%
Saturated fat:
Sat. Fat
0.159 g
Monounsaturated fat:
Mono. Fat
0.134 g
Polyunsaturated fat:
Poly. Fat
0.583 g
Contains
more
Mono. Fat Monounsaturated fat
+6109%
Contains
more
Poly. Fat Polyunsaturated fat
+965.2%
Contains
less
Sat. Fat Saturated fat
-97.8%