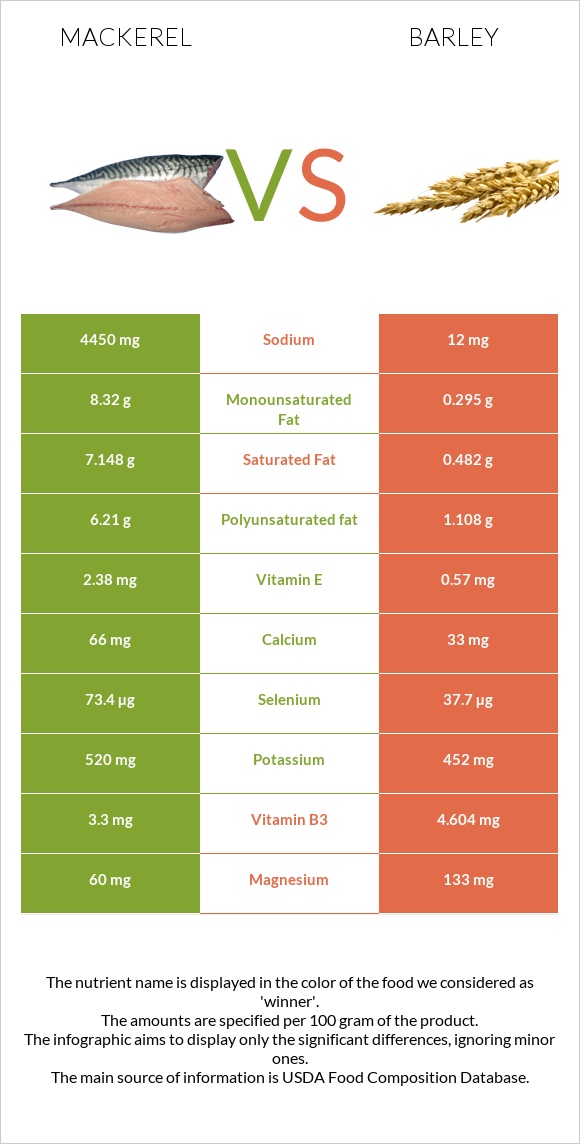
The main differences between mackerel and barley Mackerel has more vitamin B12, vitamin D* and selenium; however, barley has more fiber, vitamin B1, copper, and iron. Daily need coverage for vitamin B12 for mackerel is 500% higher. Barley is lower in cholesterol. Barley has a higher glycemic index than mackerel. Food types used in this article are Fish, mackerel, salted and Barley, hulled .
Infographic
Mineral Comparison
Mineral comparison score is based on the number of minerals by which one or the other food is richer. The "coverage" charts below show how much of the daily needs can be covered by 300 grams of the food.
3
100 g
300 g
1 cubic inch, boneless - 17g 1 piece (5-1/2" x 1-1/2" x 1/2") - 80g 1 cup, cooked - 136g
Magnesium
Magnesium
Calcium
Calcium
Potassium
Potassium
Iron
Iron
Copper
Copper
Zinc
Zinc
Phosphorus
Phosphorus
Sodium
Sodium
Manganese
Manganese
Selenium
Selenium
43%
20%
46%
53%
33%
30%
109%
580%
0%
400%
6
100 g
300 g
1 cup - 184g
Magnesium
Magnesium
Calcium
Calcium
Potassium
Potassium
Iron
Iron
Copper
Copper
Zinc
Zinc
Phosphorus
Phosphorus
Sodium
Sodium
Manganese
Manganese
Selenium
Selenium
95%
9.9%
40%
135%
166%
76%
113%
1.6%
253%
206%
Vitamin Comparison
Vitamin comparison score is based on the number of vitamins by which one or the other food is richer. The "coverage" charts below show how much of the daily needs can be covered by 300 grams of the food.
6
100 g
300 g
1 cubic inch, boneless - 17g 1 piece (5-1/2" x 1-1/2" x 1/2") - 80g 1 cup, cooked - 136g
Vitamin C
Vit. C
Vitamin D
Vit. D
Vitamin A
Vit. A
Vitamin E
Vit. E
Vitamin B1
Vit. B1
Vitamin B2
Vit. B2
Vitamin B3
Vit. B3
Vitamin B5
Vit. B5
Vitamin B6
Vit. B6
Vitamin B12
Vit. B12
Vitamin K
Vit. K
Folate
Folate
0%
378%
16%
48%
5%
44%
62%
0%
95%
1500%
20%
11%
5
100 g
300 g
1 cup - 184g
Vitamin C
Vit. C
Vitamin D
Vit. D
Vitamin A
Vit. A
Vitamin E
Vit. E
Vitamin B1
Vit. B1
Vitamin B2
Vit. B2
Vitamin B3
Vit. B3
Vitamin B5
Vit. B5
Vitamin B6
Vit. B6
Vitamin B12
Vit. B12
Vitamin K
Vit. K
Folate
Folate
0%
0%
0.33%
11%
162%
66%
86%
17%
73%
0%
5.5%
14%
All nutrients comparison - raw data values
Nutrient
DV% diff.
Vitamin B12
12µg
0µg
500%
Sodium
4450mg
12mg
193%
Vitamin D*
1006 IU
0 IU
126%
Vitamin D
25.2µg
0µg
126%
Manganese
1.943mg
84%
Fiber
0g
17.3g
69%
Selenium
73.4µg
37.7µg
65%
Vitamin B1
0.02mg
0.646mg
52%
Copper
0.1mg
0.498mg
44%
Fats
25.1g
2.3g
35%
Polyunsaturated fat
6.21g
1.108g
34%
Cholesterol
95mg
0mg
32%
Saturated fat
7.148g
0.482g
30%
Iron
1.4mg
3.6mg
28%
Carbs
0g
73.48g
24%
Monounsaturated fat
8.32g
0.295g
20%
Choline
101.6mg
18%
Magnesium
60mg
133mg
17%
Zinc
1.1mg
2.77mg
15%
Protein
18.5g
12.48g
12%
Vitamin E
2.38mg
0.57mg
12%
Vitamin B3
3.3mg
4.604mg
8%
Vitamin B2
0.19mg
0.285mg
7%
Vitamin B6
0.41mg
0.318mg
7%
Vitamin B5
0.282mg
6%
Vitamin A
47µg
1µg
5%
Vitamin K
7.8µg
2.2µg
5%
Calcium
66mg
33mg
3%
Calories
305kcal
354kcal
2%
Potassium
520mg
452mg
2%
Phosphorus
254mg
264mg
1%
Folate
15µg
19µg
1%
Protein per 100 calories
6.1g
3.5g
N/A
Calories per 10 g protein
165kcal
284kcal
N/A
Weight per 100 calories
33g
28g
N/A
Unsaturated / Saturated Fat ratio
2
2.9
N/A
Net carbs
0g
56.18g
N/A
Sugar
0g
0.8g
N/A
Tryptophan
0.208mg
0%
Threonine
0.424mg
0%
Isoleucine
0.456mg
0%
Leucine
0.848mg
0%
Lysine
0.465mg
0%
Methionine
0.24mg
0%
Phenylalanine
0.7mg
0%
Valine
0.612mg
0%
Histidine
0.281mg
0%
Omega-3 - EPA
1.619g
0g
N/A
Omega-3 - DHA
2.965g
0g
N/A
Omega-3 - DPA
0.391g
0g
N/A
Macronutrient Comparison
Macronutrient breakdown side-by-side comparison
4
19%
25%
43%
13%
Protein:
18.5 g
Fats:
25.1 g
Carbs:
0 g
Water:
43 g
Other:
13.4 g
1
12%
2%
73%
9%
2%
Protein:
12.48 g
Fats:
2.3 g
Carbs:
73.48 g
Water:
9.44 g
Other:
2.3 g
Contains
more
Protein Protein
+48.2%
Contains
more
Fats Fats
+991.3%
Contains
more
Water Water
+355.5%
Contains
more
Other Other
+482.6%
Contains
more
Carbs Carbs
+∞%
Fat Type Comparison
Fat type breakdown side-by-side comparison
2
33%
38%
29%
Saturated fat:
Sat. Fat
7.148 g
Monounsaturated fat:
Mono. Fat
8.32 g
Polyunsaturated fat:
Poly. Fat
6.21 g
1
26%
16%
59%
Saturated fat:
Sat. Fat
0.482 g
Monounsaturated fat:
Mono. Fat
0.295 g
Polyunsaturated fat:
Poly. Fat
1.108 g
Contains
more
Mono. Fat Monounsaturated fat
+2720.3%
Contains
more
Poly. Fat Polyunsaturated fat
+460.5%
Contains
less
Sat. Fat Saturated fat
-93.3%