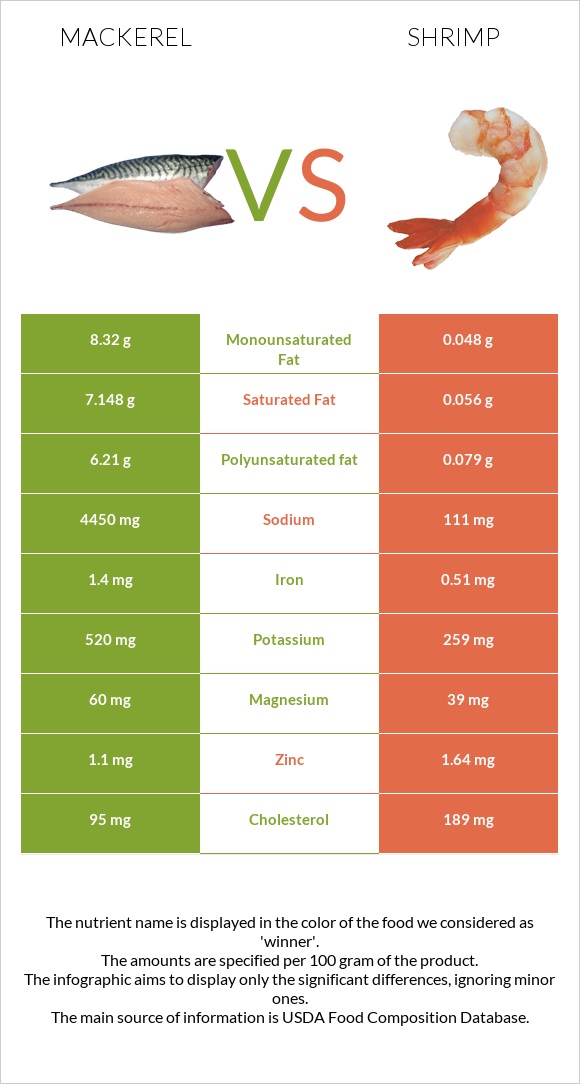
Differences between mackerel and shrimp Mackerel is higher in iron, potassium, monounsaturated fat, and polyunsaturated fat; however, shrimp is richer in copper. Mackerel's daily need coverage for sodium is 189% higher. Mackerel has 173 times more monounsaturated fat than shrimp. While mackerel has 8.32g of monounsaturated fat, shrimp has only 0.048g. Shrimp has less saturated fat. Mackerel has a lower glycemic index (0) than shrimp (50). The food types used in this comparison are Fish, mackerel, salted and Crustaceans, shrimp, cooked (not previously frozen) .
Infographic
Mineral Comparison
Mineral comparison score is based on the number of minerals by which one or the other food is richer. The "coverage" charts below show how much of the daily needs can be covered by 300 grams of the food.
4
100 g
300 g
1 cubic inch, boneless - 17g 1 piece (5-1/2" x 1-1/2" x 1/2") - 80g 1 cup, cooked - 136g
Magnesium
Magnesium
Calcium
Calcium
Potassium
Potassium
Iron
Iron
Copper
Copper
Zinc
Zinc
Phosphorus
Phosphorus
Sodium
Sodium
Manganese
Manganese
Selenium
Selenium
43%
20%
46%
53%
33%
30%
109%
580%
0%
400%
4
100 g
300 g
3 oz - 85g
Magnesium
Magnesium
Calcium
Calcium
Potassium
Potassium
Iron
Iron
Copper
Copper
Zinc
Zinc
Phosphorus
Phosphorus
Sodium
Sodium
Manganese
Manganese
Selenium
Selenium
28%
21%
23%
19%
126%
45%
102%
14%
4.3%
0%
Vitamin Comparison
Vitamin comparison score is based on the number of vitamins by which one or the other food is richer. The "coverage" charts below show how much of the daily needs can be covered by 300 grams of the food.
10
100 g
300 g
1 cubic inch, boneless - 17g 1 piece (5-1/2" x 1-1/2" x 1/2") - 80g 1 cup, cooked - 136g
Vitamin C
Vit. C
Vitamin D
Vit. D
Vitamin A
Vit. A
Vitamin E
Vit. E
Vitamin B1
Vit. B1
Vitamin B2
Vit. B2
Vitamin B3
Vit. B3
Vitamin B5
Vit. B5
Vitamin B6
Vit. B6
Vitamin B12
Vit. B12
Vitamin K
Vit. K
Folate
Folate
0%
378%
16%
48%
5%
44%
62%
0%
95%
1500%
20%
11%
0
100 g
300 g
3 oz - 85g
Vitamin C
Vit. C
Vitamin D
Vit. D
Vitamin A
Vit. A
Vitamin E
Vit. E
Vitamin B1
Vit. B1
Vitamin B2
Vit. B2
Vitamin B3
Vit. B3
Vitamin B5
Vit. B5
Vitamin B6
Vit. B6
Vitamin B12
Vit. B12
Vitamin K
Vit. K
Folate
Folate
0%
0%
0%
0%
0%
0%
0%
0%
0%
0%
0%
0%
All nutrients comparison - raw data values
Nutrient
DV% diff.
Vitamin B12
12µg
500%
Sodium
4450mg
111mg
189%
Selenium
73.4µg
133%
Vitamin D*
1006 IU
126%
Vitamin D
25.2µg
126%
Polyunsaturated fat
6.21g
0.079g
41%
Fats
25.1g
0.28g
38%
Vitamin B6
0.41mg
32%
Saturated fat
7.148g
0.056g
32%
Cholesterol
95mg
189mg
31%
Copper
0.1mg
0.379mg
31%
Vitamin B3
3.3mg
21%
Monounsaturated fat
8.32g
0.048g
21%
Choline
101.6mg
18%
Vitamin E
2.38mg
16%
Vitamin B2
0.19mg
15%
Protein
18.5g
23.98g
11%
Iron
1.4mg
0.51mg
11%
Calories
305kcal
99kcal
10%
Potassium
520mg
259mg
8%
Vitamin K
7.8µg
7%
Magnesium
60mg
39mg
5%
Zinc
1.1mg
1.64mg
5%
Vitamin A
47µg
5%
Folate
15µg
4%
Phosphorus
254mg
237mg
2%
Vitamin B1
0.02mg
2%
Manganese
0.033mg
1%
Protein per 100 calories
6.1g
24g
N/A
Calories per 10 g protein
165kcal
41kcal
N/A
Weight per 100 calories
33g
101g
N/A
Unsaturated / Saturated Fat ratio
2
2.3
N/A
Net carbs
0g
0.2g
N/A
Carbs
0g
0.2g
0%
Calcium
66mg
70mg
0%
Trans fat
0.002g
N/A
Omega-3 - EPA
1.619g
0.015g
N/A
Omega-3 - DHA
2.965g
0.015g
N/A
Omega-3 - ALA
0.001g
N/A
Omega-3 - DPA
0.391g
0.001g
N/A
Omega-6 - Dihomo-gamma-linoleic acid
0.001g
N/A
Omega-6 - Eicosadienoic acid
0.002g
N/A
Omega-6 - Linoleic acid
0.018g
N/A
Macronutrient Comparison
Macronutrient breakdown side-by-side comparison
2
19%
25%
43%
13%
Protein:
18.5 g
Fats:
25.1 g
Carbs:
0 g
Water:
43 g
Other:
13.4 g
3
24%
74%
Protein:
23.98 g
Fats:
0.28 g
Carbs:
0.2 g
Water:
74.33 g
Other:
1.21 g
Contains
more
Fats Fats
+8864.3%
Contains
more
Other Other
+1007.4%
Contains
more
Protein Protein
+29.6%
Contains
more
Carbs Carbs
+∞%
Contains
more
Water Water
+72.9%
Fat Type Comparison
Fat type breakdown side-by-side comparison
2
33%
38%
29%
Saturated fat:
Sat. Fat
7.148 g
Monounsaturated fat:
Mono. Fat
8.32 g
Polyunsaturated fat:
Poly. Fat
6.21 g
1
31%
26%
43%
Saturated fat:
Sat. Fat
0.056 g
Monounsaturated fat:
Mono. Fat
0.048 g
Polyunsaturated fat:
Poly. Fat
0.079 g
Contains
more
Mono. Fat Monounsaturated fat
+17233.3%
Contains
more
Poly. Fat Polyunsaturated fat
+7760.8%
Contains
less
Sat. Fat Saturated fat
-99.2%