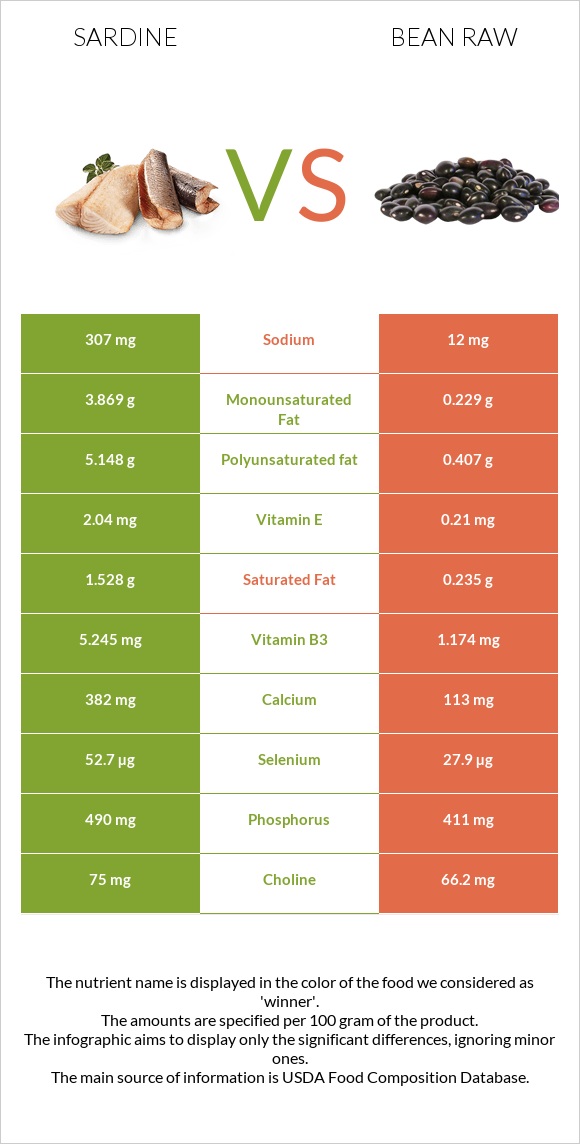
Significant differences between sardines and bean raw Sardines have more vitamin B12 and selenium; however, bean raw is richer in folate, copper, fiber, vitamin B1, manganese, magnesium, and potassium. Sardines cover your daily vitamin B12 needs 373% more than bean raw. Bean raw has a higher glycemic index. The glycemic index of bean raw is 33, while the glycemic index of sardines is 0. Specific food types used in this comparison are Fish, sardine, Atlantic, canned in oil, drained solids with bone and Beans, pinto, mature seeds, raw .
Infographic
Mineral Comparison
Mineral comparison score is based on the number of minerals by which one or the other food is richer. The "coverage" charts below show how much of the daily needs can be covered by 300 grams of the food.
3
100 g
300 g
1 small (2-2/3" x 1/2" x 1/4") - 12g 1 cubic inch - 16g 2 sardines - 24g 1 oz - 28.35g 1 can (3.75 oz) - 92g 1 cup, drained - 149g
Magnesium
Magnesium
Calcium
Calcium
Potassium
Potassium
Iron
Iron
Copper
Copper
Zinc
Zinc
Phosphorus
Phosphorus
Sodium
Sodium
Manganese
Manganese
Selenium
Selenium
28%
115%
35%
110%
62%
36%
210%
40%
14%
287%
7
100 g
300 g
1 tbsp - 12g 1 cup - 193g
Magnesium
Magnesium
Calcium
Calcium
Potassium
Potassium
Iron
Iron
Copper
Copper
Zinc
Zinc
Phosphorus
Phosphorus
Sodium
Sodium
Manganese
Manganese
Selenium
Selenium
126%
34%
123%
190%
298%
62%
176%
1.6%
150%
152%
Vitamin Comparison
Vitamin comparison score is based on the number of vitamins by which one or the other food is richer. The "coverage" charts below show how much of the daily needs can be covered by 300 grams of the food.
5
100 g
300 g
1 small (2-2/3" x 1/2" x 1/4") - 12g 1 cubic inch - 16g 2 sardines - 24g 1 oz - 28.35g 1 can (3.75 oz) - 92g 1 cup, drained - 149g
Vitamin C
Vit. C
Vitamin D
Vit. D
Vitamin A
Vit. A
Vitamin E
Vit. E
Vitamin B1
Vit. B1
Vitamin B2
Vit. B2
Vitamin B3
Vit. B3
Vitamin B5
Vit. B5
Vitamin B6
Vit. B6
Vitamin B12
Vit. B12
Vitamin K
Vit. K
Folate
Folate
0%
72%
11%
41%
20%
52%
98%
39%
39%
1118%
6.5%
7.5%
6
100 g
300 g
1 tbsp - 12g 1 cup - 193g
Vitamin C
Vit. C
Vitamin D
Vit. D
Vitamin A
Vit. A
Vitamin E
Vit. E
Vitamin B1
Vit. B1
Vitamin B2
Vit. B2
Vitamin B3
Vit. B3
Vitamin B5
Vit. B5
Vitamin B6
Vit. B6
Vitamin B12
Vit. B12
Vitamin K
Vit. K
Folate
Folate
21%
0%
0%
4.2%
178%
49%
22%
47%
109%
0%
14%
394%
All nutrients comparison - raw data values
Nutrient
DV% diff.
Vitamin B12
8.94µg
0µg
373%
Folate
10µg
525µg
129%
Copper
0.186mg
0.893mg
79%
Fiber
0g
15.5g
62%
Vitamin B1
0.08mg
0.713mg
53%
Cholesterol
142mg
0mg
47%
Manganese
0.108mg
1.148mg
45%
Selenium
52.7µg
27.9µg
45%
Magnesium
39mg
176mg
33%
Polyunsaturated fat
5.148g
0.407g
32%
Potassium
397mg
1393mg
29%
Calcium
382mg
113mg
27%
Iron
2.92mg
5.07mg
27%
Vitamin B3
5.245mg
1.174mg
25%
Vitamin D*
193 IU
0 IU
24%
Vitamin D
4.8µg
0µg
24%
Vitamin B6
0.167mg
0.474mg
24%
Carbs
0g
62.55g
21%
Fats
11.45g
1.23g
16%
Starch
34.17g
14%
Sodium
307mg
12mg
13%
Vitamin E
2.04mg
0.21mg
12%
Phosphorus
490mg
411mg
11%
Zinc
1.31mg
2.28mg
9%
Monounsaturated fat
3.869g
0.229g
9%
Calories
208kcal
347kcal
7%
Vitamin C
0mg
6.3mg
7%
Protein
24.62g
21.42g
6%
Saturated fat
1.528g
0.235g
6%
Vitamin A
32µg
0µg
4%
Vitamin B5
0.642mg
0.785mg
3%
Vitamin K
2.6µg
5.6µg
3%
Choline
75mg
66.2mg
2%
Vitamin B2
0.227mg
0.212mg
1%
Protein per 100 calories
12g
6.2g
N/A
Calories per 10 g protein
84kcal
162kcal
N/A
Weight per 100 calories
48g
29g
N/A
Unsaturated / Saturated Fat ratio
5.9
2.7
N/A
Net carbs
0g
47.05g
N/A
Sugar
0g
2.11g
N/A
Tryptophan
0.276mg
0.237mg
0%
Threonine
1.079mg
0.81mg
0%
Isoleucine
1.134mg
0.871mg
0%
Leucine
2.001mg
1.558mg
0%
Lysine
2.26mg
1.356mg
0%
Methionine
0.729mg
0.259mg
0%
Phenylalanine
0.961mg
1.095mg
0%
Valine
1.268mg
0.998mg
0%
Histidine
0.725mg
0.556mg
0%
Omega-3 - EPA
0.473g
0g
N/A
Omega-3 - DHA
0.509g
0g
N/A
Macronutrient Comparison
Macronutrient breakdown side-by-side comparison
4
25%
11%
60%
4%
Protein:
24.62 g
Fats:
11.45 g
Carbs:
0 g
Water:
59.61 g
Other:
4.32 g
1
21%
63%
11%
3%
Protein:
21.42 g
Fats:
1.23 g
Carbs:
62.55 g
Water:
11.33 g
Other:
3.47 g
Contains
more
Protein Protein
+14.9%
Contains
more
Fats Fats
+830.9%
Contains
more
Water Water
+426.1%
Contains
more
Other Other
+24.5%
Contains
more
Carbs Carbs
+∞%
Fat Type Comparison
Fat type breakdown side-by-side comparison
2
14%
37%
49%
Saturated fat:
Sat. Fat
1.528 g
Monounsaturated fat:
Mono. Fat
3.869 g
Polyunsaturated fat:
Poly. Fat
5.148 g
1
27%
26%
47%
Saturated fat:
Sat. Fat
0.235 g
Monounsaturated fat:
Mono. Fat
0.229 g
Polyunsaturated fat:
Poly. Fat
0.407 g
Contains
more
Mono. Fat Monounsaturated fat
+1589.5%
Contains
more
Poly. Fat Polyunsaturated fat
+1164.9%
Contains
less
Sat. Fat Saturated fat
-84.6%