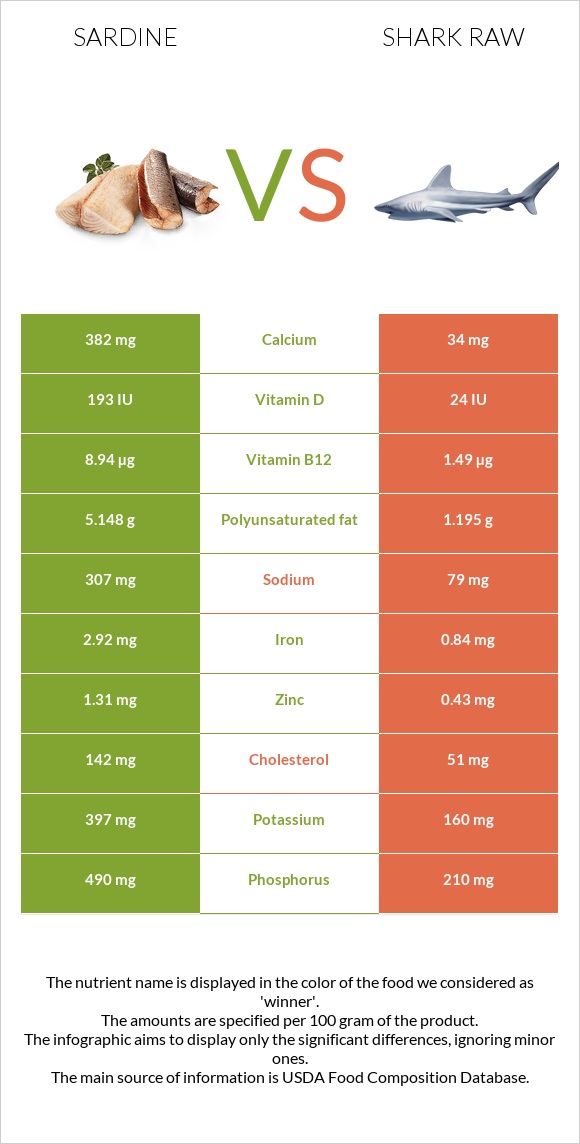
Summary of differences between sardines and shark raw Sardines have more vitamin B12, phosphorus, calcium, selenium, iron, vitamin D*, copper, and vitamin B3; however, shark raw is higher in vitamin B6. Sardines cover your daily need for vitamin B12, 310% more than shark raw. Sardines have 11 times more calcium than shark raw. While sardines have 382mg of calcium, shark raw has only 34mg. Shark raw has less cholesterol. These are the specific foods used in this comparison Fish, sardine, Atlantic, canned in oil, drained solids with bone and Fish, shark, mixed species, raw .
Infographic
Mineral Comparison
Mineral comparison score is based on the number of minerals by which one or the other food is richer. The "coverage" charts below show how much of the daily needs can be covered by 300 grams of the food.
8
100 g
300 g
1 small (2-2/3" x 1/2" x 1/4") - 12g 1 cubic inch - 16g 2 sardines - 24g 1 oz - 28.35g 1 can (3.75 oz) - 92g 1 cup, drained - 149g
Magnesium
Magnesium
Calcium
Calcium
Potassium
Potassium
Iron
Iron
Copper
Copper
Zinc
Zinc
Phosphorus
Phosphorus
Sodium
Sodium
Manganese
Manganese
Selenium
Selenium
28%
115%
35%
110%
62%
36%
210%
40%
14%
287%
2
100 g
300 g
3 oz - 85g
Magnesium
Magnesium
Calcium
Calcium
Potassium
Potassium
Iron
Iron
Copper
Copper
Zinc
Zinc
Phosphorus
Phosphorus
Sodium
Sodium
Manganese
Manganese
Selenium
Selenium
35%
10%
14%
32%
11%
12%
90%
10%
2%
199%
Vitamin Comparison
Vitamin comparison score is based on the number of vitamins by which one or the other food is richer. The "coverage" charts below show how much of the daily needs can be covered by 300 grams of the food.
8
100 g
300 g
1 small (2-2/3" x 1/2" x 1/4") - 12g 1 cubic inch - 16g 2 sardines - 24g 1 oz - 28.35g 1 can (3.75 oz) - 92g 1 cup, drained - 149g
Vitamin C
Vit. C
Vitamin D
Vit. D
Vitamin A
Vit. A
Vitamin E
Vit. E
Vitamin B1
Vit. B1
Vitamin B2
Vit. B2
Vitamin B3
Vit. B3
Vitamin B5
Vit. B5
Vitamin B6
Vit. B6
Vitamin B12
Vit. B12
Vitamin K
Vit. K
Folate
Folate
0%
72%
11%
41%
20%
52%
98%
39%
39%
1118%
6.5%
7.5%
2
100 g
300 g
3 oz - 85g
Vitamin C
Vit. C
Vitamin D
Vit. D
Vitamin A
Vit. A
Vitamin E
Vit. E
Vitamin B1
Vit. B1
Vitamin B2
Vit. B2
Vitamin B3
Vit. B3
Vitamin B5
Vit. B5
Vitamin B6
Vit. B6
Vitamin B12
Vit. B12
Vitamin K
Vit. K
Folate
Folate
0%
9%
23%
20%
11%
14%
55%
42%
92%
186%
0.25%
2.3%
All nutrients comparison - raw data values
Nutrient
DV% diff.
Vitamin B12
8.94µg
1.49µg
310%
Phosphorus
490mg
210mg
40%
Calcium
382mg
34mg
35%
Cholesterol
142mg
51mg
30%
Selenium
52.7µg
36.5µg
29%
Iron
2.92mg
0.84mg
26%
Polyunsaturated fat
5.148g
1.195g
26%
Vitamin D*
193 IU
24 IU
21%
Vitamin D
4.8µg
0.6µg
21%
Vitamin B6
0.167mg
0.4mg
18%
Copper
0.186mg
0.033mg
17%
Vitamin B3
5.245mg
2.938mg
14%
Vitamin B2
0.227mg
0.062mg
13%
Fats
11.45g
4.51g
11%
Sodium
307mg
79mg
10%
Zinc
1.31mg
0.43mg
8%
Protein
24.62g
20.98g
7%
Potassium
397mg
160mg
7%
Vitamin E
2.04mg
1mg
7%
Monounsaturated fat
3.869g
1.808g
5%
Calories
208kcal
130kcal
4%
Vitamin A
32µg
70µg
4%
Manganese
0.108mg
0.015mg
4%
Vitamin B1
0.08mg
0.042mg
3%
Saturated fat
1.528g
0.925g
3%
Magnesium
39mg
49mg
2%
Vitamin K
2.6µg
0.1µg
2%
Folate
10µg
3µg
2%
Choline
75mg
65mg
2%
Vitamin B5
0.642mg
0.695mg
1%
Protein per 100 calories
12g
16g
N/A
Calories per 10 g protein
84kcal
62kcal
N/A
Weight per 100 calories
48g
77g
N/A
Unsaturated / Saturated Fat ratio
5.9
3.2
N/A
Tryptophan
0.276mg
0.235mg
0%
Threonine
1.079mg
0.92mg
0%
Isoleucine
1.134mg
0.967mg
0%
Leucine
2.001mg
1.705mg
0%
Lysine
2.26mg
1.926mg
0%
Methionine
0.729mg
0.621mg
0%
Phenylalanine
0.961mg
0.819mg
0%
Valine
1.268mg
1.081mg
0%
Histidine
0.725mg
0.618mg
0%
Omega-3 - EPA
0.473g
0.316g
N/A
Omega-3 - DHA
0.509g
0.527g
N/A
Omega-3 - DPA
0g
0.109g
N/A
Macronutrient Comparison
Macronutrient breakdown side-by-side comparison
3
25%
11%
60%
4%
Protein:
24.62 g
Fats:
11.45 g
Carbs:
0 g
Water:
59.61 g
Other:
4.32 g
1
21%
5%
74%
Protein:
20.98 g
Fats:
4.51 g
Carbs:
0 g
Water:
73.58 g
Other:
0.93 g
Contains
more
Protein Protein
+17.3%
Contains
more
Fats Fats
+153.9%
Contains
more
Other Other
+364.5%
Contains
more
Water Water
+23.4%
Fat Type Comparison
Fat type breakdown side-by-side comparison
2
14%
37%
49%
Saturated fat:
Sat. Fat
1.528 g
Monounsaturated fat:
Mono. Fat
3.869 g
Polyunsaturated fat:
Poly. Fat
5.148 g
1
24%
46%
30%
Saturated fat:
Sat. Fat
0.925 g
Monounsaturated fat:
Mono. Fat
1.808 g
Polyunsaturated fat:
Poly. Fat
1.195 g
Contains
more
Mono. Fat Monounsaturated fat
+114%
Contains
more
Poly. Fat Polyunsaturated fat
+330.8%
Contains
less
Sat. Fat Saturated fat
-39.5%