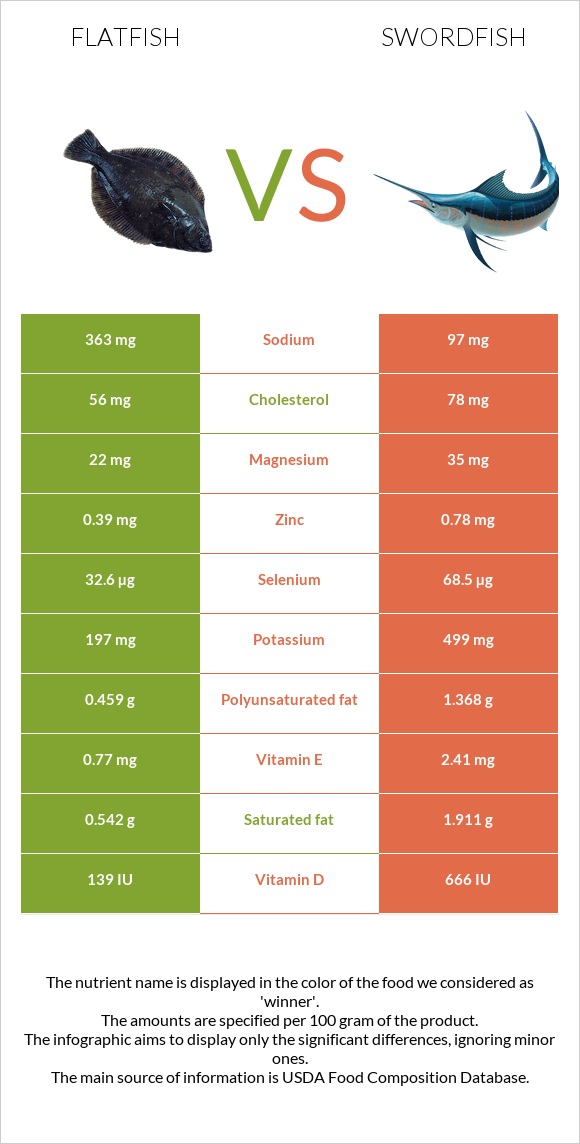
Significant differences between flatfish and swordfish The amount of vitamin D*, selenium, vitamin B3, vitamin B6, vitamin B12, vitamin E, and potassium in swordfish is higher than in flatfish. Swordfish covers your daily vitamin D* needs 66% more than flatfish. Swordfish has 4 times less sodium than flatfish. Flatfish has 363mg of sodium, while swordfish has 97mg. Specific food types used in this comparison are Fish, flatfish (flounder and sole species), cooked, dry heat and Fish, swordfish, cooked, dry heat .
Infographic
Mineral Comparison
Mineral comparison score is based on the number of minerals by which one or the other food is richer. The "coverage" charts below show how much of the daily needs can be covered by 300 grams of the food.
2
100 g
300 g
3 oz - 85g 1 fillet - 127g
Magnesium
Magnesium
Calcium
Calcium
Potassium
Potassium
Iron
Iron
Copper
Copper
Zinc
Zinc
Phosphorus
Phosphorus
Sodium
Sodium
Manganese
Manganese
Selenium
Selenium
16%
7.5%
17%
8.6%
7.7%
11%
132%
47%
2.2%
178%
7
100 g
300 g
3 oz - 85g 1 piece - 106g
Magnesium
Magnesium
Calcium
Calcium
Potassium
Potassium
Iron
Iron
Copper
Copper
Zinc
Zinc
Phosphorus
Phosphorus
Sodium
Sodium
Manganese
Manganese
Selenium
Selenium
25%
1.8%
44%
17%
15%
21%
130%
13%
1.7%
374%
Vitamin Comparison
Vitamin comparison score is based on the number of vitamins by which one or the other food is richer. The "coverage" charts below show how much of the daily needs can be covered by 300 grams of the food.
1
100 g
300 g
3 oz - 85g 1 fillet - 127g
Vitamin C
Vit. C
Vitamin D
Vit. D
Vitamin A
Vit. A
Vitamin E
Vit. E
Vitamin B1
Vit. B1
Vitamin B2
Vit. B2
Vitamin B3
Vit. B3
Vitamin B5
Vit. B5
Vitamin B6
Vit. B6
Vitamin B12
Vit. B12
Vitamin K
Vit. K
Folate
Folate
0%
53%
4%
15%
6.5%
5.8%
24%
14%
27%
164%
0.25%
4.5%
9
100 g
300 g
3 oz - 85g 1 piece - 106g
Vitamin C
Vit. C
Vitamin D
Vit. D
Vitamin A
Vit. A
Vitamin E
Vit. E
Vitamin B1
Vit. B1
Vitamin B2
Vit. B2
Vitamin B3
Vit. B3
Vitamin B5
Vit. B5
Vitamin B6
Vit. B6
Vitamin B12
Vit. B12
Vitamin K
Vit. K
Folate
Folate
0%
249%
14%
48%
22%
15%
174%
25%
142%
203%
0.25%
1.5%
All nutrients comparison - raw data values
Nutrient
DV% diff.
Vitamin D*
139 IU
666 IU
66%
Vitamin D
3.5µg
16.6µg
66%
Selenium
32.6µg
68.5µg
65%
Vitamin B3
1.278mg
9.254mg
50%
Vitamin B6
0.115mg
0.615mg
38%
Protein
15.24g
23.45g
16%
Vitamin B12
1.31µg
1.62µg
13%
Sodium
363mg
97mg
12%
Vitamin E
0.77mg
2.41mg
11%
Fats
2.37g
7.93g
9%
Potassium
197mg
499mg
9%
Cholesterol
56mg
78mg
7%
Monounsaturated fat
0.657g
3.544g
7%
Saturated fat
0.542g
1.911g
6%
Polyunsaturated fat
0.459g
1.368g
6%
Vitamin B1
0.026mg
0.089mg
5%
Calories
86kcal
172kcal
4%
Zinc
0.39mg
0.78mg
4%
Vitamin B5
0.227mg
0.417mg
4%
Magnesium
22mg
35mg
3%
Iron
0.23mg
0.45mg
3%
Copper
0.023mg
0.046mg
3%
Vitamin A
12µg
43µg
3%
Vitamin B2
0.025mg
0.063mg
3%
Calcium
25mg
6mg
2%
Phosphorus
309mg
304mg
1%
Folate
6µg
2µg
1%
Protein per 100 calories
18g
14g
N/A
Calories per 10 g protein
56kcal
73kcal
N/A
Weight per 100 calories
116g
58g
N/A
Unsaturated / Saturated Fat ratio
2.1
2.6
N/A
Manganese
0.017mg
0.013mg
0%
Vitamin K
0.1µg
0.1µg
0%
Trans fat
0.014g
0.056g
N/A
Choline
79.9mg
77.5mg
0%
Tryptophan
0.197mg
0.265mg
0%
Threonine
0.719mg
1.035mg
0%
Isoleucine
0.754mg
1.088mg
0%
Leucine
1.335mg
1.919mg
0%
Lysine
1.561mg
2.168mg
0%
Methionine
0.56mg
0.699mg
0%
Phenylalanine
0.624mg
0.922mg
0%
Valine
0.8mg
1.216mg
0%
Histidine
0.374mg
0.695mg
0%
Omega-3 - EPA
0.168g
0.127g
N/A
Omega-3 - DHA
0.132g
0.772g
N/A
Omega-3 - DPA
0.034g
0.168g
N/A
Omega-6 - Eicosadienoic acid
0.006g
0.022g
N/A
Macronutrient Comparison
Macronutrient breakdown side-by-side comparison
2
15%
2%
81%
Protein:
15.24 g
Fats:
2.37 g
Carbs:
0 g
Water:
81.11 g
Other:
1.28 g
2
23%
8%
68%
Protein:
23.45 g
Fats:
7.93 g
Carbs:
0 g
Water:
68.26 g
Other:
0.36 g
Contains
more
Water Water
+18.8%
Contains
more
Other Other
+255.6%
Contains
more
Protein Protein
+53.9%
Contains
more
Fats Fats
+234.6%
Fat Type Comparison
Fat type breakdown side-by-side comparison
1
33%
40%
28%
Saturated fat:
Sat. Fat
0.542 g
Monounsaturated fat:
Mono. Fat
0.657 g
Polyunsaturated fat:
Poly. Fat
0.459 g
2
28%
52%
20%
Saturated fat:
Sat. Fat
1.911 g
Monounsaturated fat:
Mono. Fat
3.544 g
Polyunsaturated fat:
Poly. Fat
1.368 g
Contains
less
Sat. Fat Saturated fat
-71.6%
Contains
more
Mono. Fat Monounsaturated fat
+439.4%
Contains
more
Poly. Fat Polyunsaturated fat
+198%