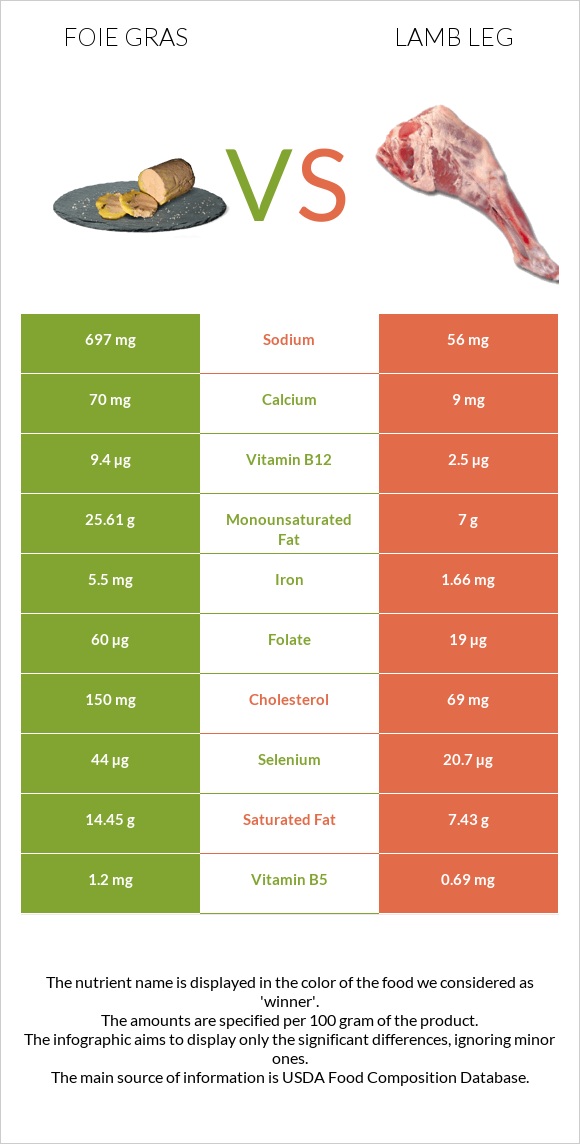
Summary of differences between foie gras and lamb leg Foie gras has more vitamin B12, vitamin A, iron, selenium, and copper, while lamb leg has more vitamin B3 and zinc. Foie gras covers your daily need for vitamin B12, 287% more than lamb leg. The amount of sodium in lamb leg is lower. These are the specific foods used in this comparison Pate de foie gras, canned (goose liver pate), smoked and Lamb, domestic, leg, whole (shank and sirloin), separable lean, and fat, trimmed to 1/4" fat, choice, raw .
Infographic
Mineral Comparison
Mineral comparison score is based on the number of minerals by which one or the other food is richer. The "coverage" charts below show how much of the daily needs can be covered by 300 grams of the food.
6
100 g
300 g
1 tbsp - 13g 1 oz - 28.35g
Magnesium
Magnesium
Calcium
Calcium
Potassium
Potassium
Iron
Iron
Copper
Copper
Zinc
Zinc
Phosphorus
Phosphorus
Sodium
Sodium
Manganese
Manganese
Selenium
Selenium
9.3%
21%
12%
206%
133%
25%
86%
91%
16%
240%
4
100 g
300 g
1 oz - 28.35g 1 lb - 453.6g
Magnesium
Magnesium
Calcium
Calcium
Potassium
Potassium
Iron
Iron
Copper
Copper
Zinc
Zinc
Phosphorus
Phosphorus
Sodium
Sodium
Manganese
Manganese
Selenium
Selenium
16%
2.7%
22%
62%
38%
91%
73%
7.3%
2.6%
113%
Vitamin Comparison
Vitamin comparison score is based on the number of vitamins by which one or the other food is richer. The "coverage" charts below show how much of the daily needs can be covered by 300 grams of the food.
6
100 g
300 g
1 tbsp - 13g 1 oz - 28.35g
Vitamin C
Vit. C
Vitamin D
Vit. D
Vitamin A
Vit. A
Vitamin E
Vit. E
Vitamin B1
Vit. B1
Vitamin B2
Vit. B2
Vitamin B3
Vit. B3
Vitamin B5
Vit. B5
Vitamin B6
Vit. B6
Vitamin B12
Vit. B12
Vitamin K
Vit. K
Folate
Folate
6.7%
0%
334%
0%
22%
69%
47%
72%
14%
1175%
0%
45%
4
100 g
300 g
1 oz - 28.35g 1 lb - 453.6g
Vitamin C
Vit. C
Vitamin D
Vit. D
Vitamin A
Vit. A
Vitamin E
Vit. E
Vitamin B1
Vit. B1
Vitamin B2
Vit. B2
Vitamin B3
Vit. B3
Vitamin B5
Vit. B5
Vitamin B6
Vit. B6
Vitamin B12
Vit. B12
Vitamin K
Vit. K
Folate
Folate
0%
0%
0%
4.2%
33%
53%
117%
41%
35%
313%
0%
14%
All nutrients comparison - raw data values
Nutrient
DV% diff.
Vitamin B12
9.4µg
2.5µg
288%
Vitamin A
1001µg
0µg
111%
Iron
5.5mg
1.66mg
48%
Monounsaturated fat
25.61g
7g
47%
Selenium
44µg
20.7µg
42%
Fats
43.84g
17.07g
41%
Copper
0.4mg
0.113mg
32%
Saturated fat
14.45g
7.43g
32%
Sodium
697mg
56mg
28%
Cholesterol
150mg
69mg
27%
Vitamin B3
2.51mg
6.26mg
23%
Zinc
0.92mg
3.32mg
22%
Protein
11.4g
17.91g
13%
Calories
462kcal
230kcal
12%
Vitamin B5
1.2mg
0.69mg
10%
Folate
60µg
19µg
10%
Vitamin B6
0.06mg
0.15mg
7%
Calcium
70mg
9mg
6%
Vitamin B2
0.299mg
0.23mg
5%
Phosphorus
200mg
170mg
4%
Manganese
0.12mg
0.02mg
4%
Vitamin B1
0.088mg
0.13mg
4%
Potassium
138mg
249mg
3%
Polyunsaturated fat
0.84g
1.35g
3%
Vitamin C
2mg
0mg
2%
Carbs
4.67g
0g
2%
Magnesium
13mg
23mg
2%
Vitamin E
0.21mg
1%
Protein per 100 calories
2.5g
7.8g
N/A
Calories per 10 g protein
405kcal
128kcal
N/A
Weight per 100 calories
22g
43g
N/A
Unsaturated / Saturated Fat ratio
1.8
1.1
N/A
Net carbs
4.67g
0g
N/A
Tryptophan
0.161mg
0.209mg
0%
Threonine
0.507mg
0.767mg
0%
Isoleucine
0.606mg
0.864mg
0%
Leucine
1.029mg
1.393mg
0%
Lysine
0.863mg
1.582mg
0%
Methionine
0.27mg
0.46mg
0%
Phenylalanine
0.567mg
0.729mg
0%
Valine
0.719mg
0.967mg
0%
Histidine
0.303mg
0.567mg
0%
Macronutrient Comparison
Macronutrient breakdown side-by-side comparison
3
11%
44%
5%
37%
3%
Protein:
11.4 g
Fats:
43.84 g
Carbs:
4.67 g
Water:
37.04 g
Other:
3.05 g
2
18%
17%
64%
Protein:
17.91 g
Fats:
17.07 g
Carbs:
0 g
Water:
64.32 g
Other:
0.7 g
Contains
more
Fats Fats
+156.8%
Contains
more
Carbs Carbs
+∞%
Contains
more
Other Other
+335.7%
Contains
more
Protein Protein
+57.1%
Contains
more
Water Water
+73.7%
Fat Type Comparison
Fat type breakdown side-by-side comparison
1
35%
63%
2%
Saturated fat:
Sat. Fat
14.45 g
Monounsaturated fat:
Mono. Fat
25.61 g
Polyunsaturated fat:
Poly. Fat
0.84 g
2
47%
44%
9%
Saturated fat:
Sat. Fat
7.43 g
Monounsaturated fat:
Mono. Fat
7 g
Polyunsaturated fat:
Poly. Fat
1.35 g
Contains
more
Mono. Fat Monounsaturated fat
+265.9%
Contains
less
Sat. Fat Saturated fat
-48.6%
Contains
more
Poly. Fat Polyunsaturated fat
+60.7%