French fries vs. Ginger — In-Depth Nutrition Comparison
Compare
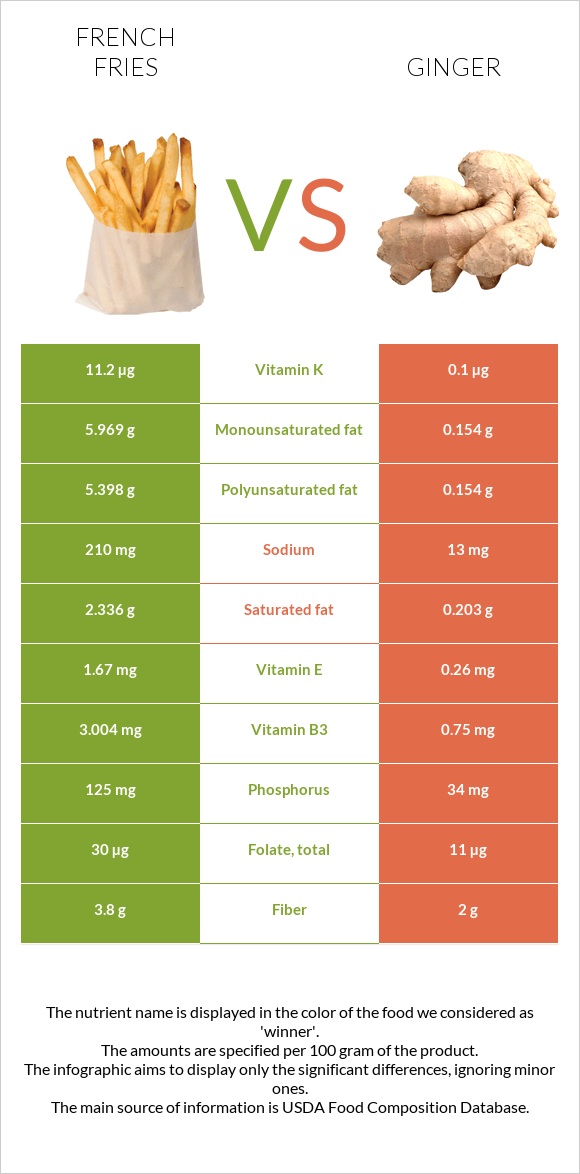
The main differences between french fries and ginger
- French fries are richer in vitamin B6, vitamin B3, phosphorus, vitamin B1, vitamin E, vitamin K, and vitamin B5, yet ginger is richer in copper.
- Daily need coverage for vitamin B6 for french fries is 16% higher.
- French fries contain 112 times more vitamin K than ginger. French fries contain 11.2µg of vitamin K, while ginger contains 0.1µg.
- Ginger contains less sodium.
- Ginger has a lower glycemic index than french fries.
Food types used in this article are Fast foods, potato, french fried in vegetable oil and Ginger root, raw.
Infographic
Infographic link
Mineral Comparison
Mineral comparison score is based on the number of minerals by which one or the other food is richer. The "coverage" charts below show how much of the daily needs can be covered by 300 grams of the food.
| Contains more CalciumCalcium | +12.5% |
| Contains more PotassiumPotassium | +39.5% |
| Contains more IronIron | +35% |
| Contains more ZincZinc | +47.1% |
| Contains more PhosphorusPhosphorus | +267.6% |
| Contains more SeleniumSelenium | +28.6% |
| Contains more MagnesiumMagnesium | +22.9% |
| Contains more CopperCopper | +82.3% |
| Contains less SodiumSodium | -93.8% |
Vitamin Comparison
Vitamin comparison score is based on the number of vitamins by which one or the other food is richer. The "coverage" charts below show how much of the daily needs can be covered by 300 grams of the food.
| Contains more Vitamin EVitamin E | +542.3% |
| Contains more Vitamin B1Vitamin B1 | +580% |
| Contains more Vitamin B2Vitamin B2 | +14.7% |
| Contains more Vitamin B3Vitamin B3 | +300.5% |
| Contains more Vitamin B5Vitamin B5 | +185.7% |
| Contains more Vitamin B6Vitamin B6 | +132.5% |
| Contains more Vitamin KVitamin K | +11100% |
| Contains more FolateFolate | +172.7% |
All nutrients comparison - raw data values
| Nutrient |  |
 |
DV% diff. |
| Polyunsaturated fat | 5.398g | 0.154g | 35% |
| Fats | 14.73g | 0.75g | 22% |
| Vitamin B6 | 0.372mg | 0.16mg | 16% |
| Monounsaturated fat | 5.969g | 0.154g | 15% |
| Vitamin B3 | 3.004mg | 0.75mg | 14% |
| Phosphorus | 125mg | 34mg | 13% |
| Calories | 312kcal | 80kcal | 12% |
| Vitamin B1 | 0.17mg | 0.025mg | 12% |
| Copper | 0.124mg | 0.226mg | 11% |
| Saturated fat | 2.336g | 0.203g | 10% |
| Sodium | 210mg | 13mg | 9% |
| Vitamin E | 1.67mg | 0.26mg | 9% |
| Vitamin K | 11.2µg | 0.1µg | 9% |
| Carbs | 41.44g | 17.77g | 8% |
| Vitamin B5 | 0.58mg | 0.203mg | 8% |
| Fiber | 3.8g | 2g | 7% |
| Potassium | 579mg | 415mg | 5% |
| Folate | 30µg | 11µg | 5% |
| Protein | 3.43g | 1.82g | 3% |
| Iron | 0.81mg | 0.6mg | 3% |
| Magnesium | 35mg | 43mg | 2% |
| Zinc | 0.5mg | 0.34mg | 1% |
| Manganese | 0.247mg | 0.229mg | 1% |
| Choline | 36.8mg | 28.8mg | 1% |
| Vitamin C | 4.7mg | 5mg | 0% |
| Net carbs | 37.64g | 15.77g | N/A |
| Calcium | 18mg | 16mg | 0% |
| Sugar | 0.3g | 1.7g | N/A |
| Selenium | 0.9µg | 0.7µg | 0% |
| Vitamin B2 | 0.039mg | 0.034mg | 0% |
| Trans fat | 0.06g | 0g | N/A |
| Tryptophan | 0.012mg | 0% | |
| Threonine | 0.036mg | 0% | |
| Isoleucine | 0.051mg | 0% | |
| Leucine | 0.074mg | 0% | |
| Lysine | 0.057mg | 0% | |
| Methionine | 0.013mg | 0% | |
| Phenylalanine | 0.045mg | 0% | |
| Valine | 0.073mg | 0% | |
| Histidine | 0.03mg | 0% | |
| Omega-3 - ALA | 0.407g | N/A | |
| Omega-3 - Eicosatrienoic acid | 0.001g | N/A | |
| Omega-6 - Gamma-linoleic acid | 0.029g | N/A | |
| Omega-6 - Eicosadienoic acid | 0.007g | N/A | |
| Omega-6 - Linoleic acid | 4.898g | N/A |
Macronutrient Comparison
Macronutrient breakdown side-by-side comparison
Protein:
3.43 g
Fats:
14.73 g
Carbs:
41.44 g
Water:
38.55 g
Other:
1.85 g
Protein:
1.82 g
Fats:
0.75 g
Carbs:
17.77 g
Water:
78.89 g
Other:
0.77 g
| Contains more ProteinProtein | +88.5% |
| Contains more FatsFats | +1864% |
| Contains more CarbsCarbs | +133.2% |
| Contains more OtherOther | +140.3% |
| Contains more WaterWater | +104.6% |
Fat Type Comparison
Fat type breakdown side-by-side comparison
Saturated fat:
Sat. Fat
2.336 g
Monounsaturated fat:
Mono. Fat
5.969 g
Polyunsaturated fat:
Poly. Fat
5.398 g
Saturated fat:
Sat. Fat
0.203 g
Monounsaturated fat:
Mono. Fat
0.154 g
Polyunsaturated fat:
Poly. Fat
0.154 g
| Contains more Mono. FatMonounsaturated fat | +3776% |
| Contains more Poly. FatPolyunsaturated fat | +3405.2% |
| Contains less Sat. FatSaturated fat | -91.3% |


