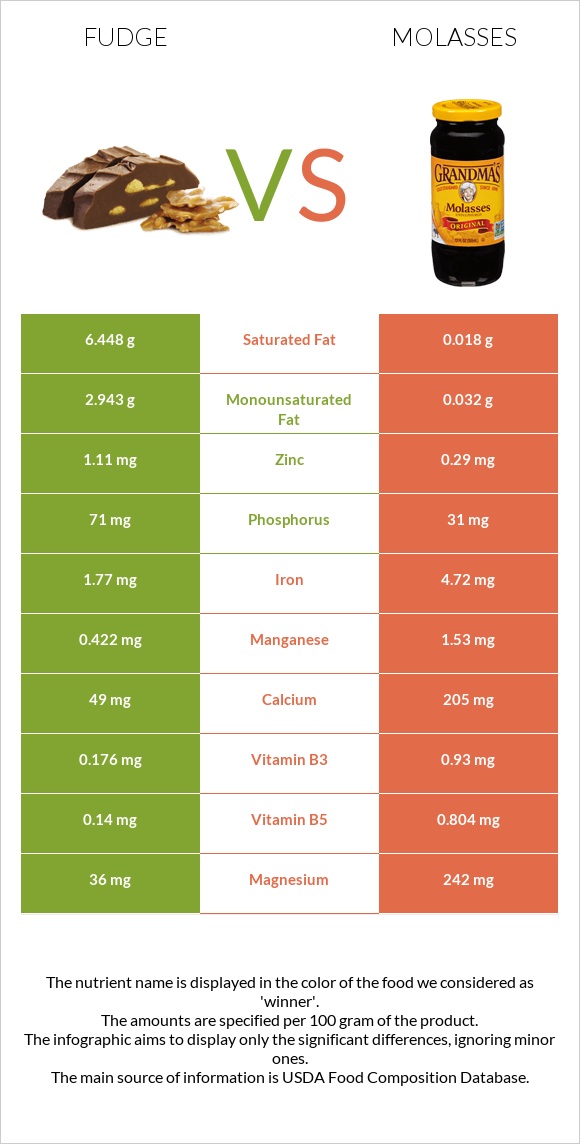
The main differences between fudge and molasses Fudge contains less vitamin B6, magnesium, manganese, potassium, iron, selenium, copper, calcium, and vitamin B5 than molasses. Daily need coverage for vitamin B6 for molasses is 51% higher. Molasses have 358 times less saturated fat than fudge. Fudge has 6.448g of saturated fat, while molasses have 0.018g. Food types used in this article are Candies, fudge, chocolate, prepared-from-recipe and Molasses .
Infographic
Mineral Comparison
Mineral comparison score is based on the number of minerals by which one or the other food is richer. The "coverage" charts below show how much of the daily needs can be covered by 300 grams of the food.
2
100 g
300 g
1 piece - 17g
Magnesium
Magnesium
Calcium
Calcium
Potassium
Potassium
Iron
Iron
Copper
Copper
Zinc
Zinc
Phosphorus
Phosphorus
Sodium
Sodium
Manganese
Manganese
Selenium
Selenium
26%
15%
12%
66%
110%
30%
30%
5.9%
55%
14%
8
100 g
300 g
1 serving 1 tbsp - 20g 1 cup - 337g
Magnesium
Magnesium
Calcium
Calcium
Potassium
Potassium
Iron
Iron
Copper
Copper
Zinc
Zinc
Phosphorus
Phosphorus
Sodium
Sodium
Manganese
Manganese
Selenium
Selenium
173%
62%
129%
177%
162%
7.9%
13%
4.8%
200%
97%
Vitamin Comparison
Vitamin comparison score is based on the number of vitamins by which one or the other food is richer. The "coverage" charts below show how much of the daily needs can be covered by 300 grams of the food.
6
100 g
300 g
1 piece - 17g
Vitamin C
Vit. C
Vitamin D
Vit. D
Vitamin A
Vit. A
Vitamin E
Vit. E
Vitamin B1
Vit. B1
Vitamin B2
Vit. B2
Vitamin B3
Vit. B3
Vitamin B5
Vit. B5
Vitamin B6
Vit. B6
Vitamin B12
Vit. B12
Vitamin K
Vit. K
Folate
Folate
0%
0%
15%
3.6%
6.5%
20%
3.3%
8.4%
2.8%
11%
3.5%
3%
4
100 g
300 g
1 serving 1 tbsp - 20g 1 cup - 337g
Vitamin C
Vit. C
Vitamin D
Vit. D
Vitamin A
Vit. A
Vitamin E
Vit. E
Vitamin B1
Vit. B1
Vitamin B2
Vit. B2
Vitamin B3
Vit. B3
Vitamin B5
Vit. B5
Vitamin B6
Vit. B6
Vitamin B12
Vit. B12
Vitamin K
Vit. K
Folate
Folate
0%
0%
0%
0%
10%
0.46%
17%
48%
155%
0%
0%
0%
All nutrients comparison - raw data values
Nutrient
DV% diff.
Vitamin B6
0.012mg
0.67mg
51%
Magnesium
36mg
242mg
49%
Manganese
0.422mg
1.53mg
48%
Potassium
134mg
1464mg
39%
Iron
1.77mg
4.72mg
37%
Saturated fat
6.448g
0.018g
29%
Selenium
2.5µg
17.8µg
28%
Copper
0.329mg
0.487mg
18%
Fats
10.41g
0.1g
16%
Calcium
49mg
205mg
16%
Fructose
12.79g
16%
Vitamin B5
0.14mg
0.804mg
13%
Fiber
1.7g
0g
7%
Zinc
1.11mg
0.29mg
7%
Monounsaturated fat
2.943g
0.032g
7%
Calories
411kcal
290kcal
6%
Phosphorus
71mg
31mg
6%
Vitamin B2
0.085mg
0.002mg
6%
Protein
2.39g
0g
5%
Cholesterol
14mg
0mg
5%
Vitamin A
44µg
0µg
5%
Vitamin B3
0.176mg
0.93mg
5%
Vitamin B12
0.09µg
0µg
4%
Polyunsaturated fat
0.373g
0.05g
2%
Caffeine
8mg
0mg
2%
Carbs
76.44g
74.73g
1%
Vitamin E
0.18mg
0mg
1%
Vitamin B1
0.026mg
0.041mg
1%
Vitamin K
1.4µg
0µg
1%
Folate
4µg
0µg
1%
Choline
10mg
13.3mg
1%
Weight per 100 calories
24g
34g
N/A
Unsaturated / Saturated Fat ratio
0.51
4.6
N/A
Net carbs
74.74g
74.73g
N/A
Sugar
73.12g
74.72g
N/A
Sodium
45mg
37mg
0%
Trans fat
0.165g
N/A
Macronutrient Comparison
Macronutrient breakdown side-by-side comparison
3
2%
10%
76%
10%
Protein:
2.39 g
Fats:
10.41 g
Carbs:
76.44 g
Water:
9.81 g
Other:
0.95 g
2
75%
22%
3%
Protein:
0 g
Fats:
0.1 g
Carbs:
74.73 g
Water:
21.87 g
Other:
3.3 g
Contains
more
Protein Protein
+∞%
Contains
more
Fats Fats
+10310%
Contains
more
Water Water
+122.9%
Contains
more
Other Other
+247.4%
Fat Type Comparison
Fat type breakdown side-by-side comparison
2
66%
30%
4%
Saturated fat:
Sat. Fat
6.448 g
Monounsaturated fat:
Mono. Fat
2.943 g
Polyunsaturated fat:
Poly. Fat
0.373 g
1
18%
32%
50%
Saturated fat:
Sat. Fat
0.018 g
Monounsaturated fat:
Mono. Fat
0.032 g
Polyunsaturated fat:
Poly. Fat
0.05 g
Contains
more
Mono. Fat Monounsaturated fat
+9096.9%
Contains
more
Poly. Fat Polyunsaturated fat
+646%
Contains
less
Sat. Fat Saturated fat
-99.7%