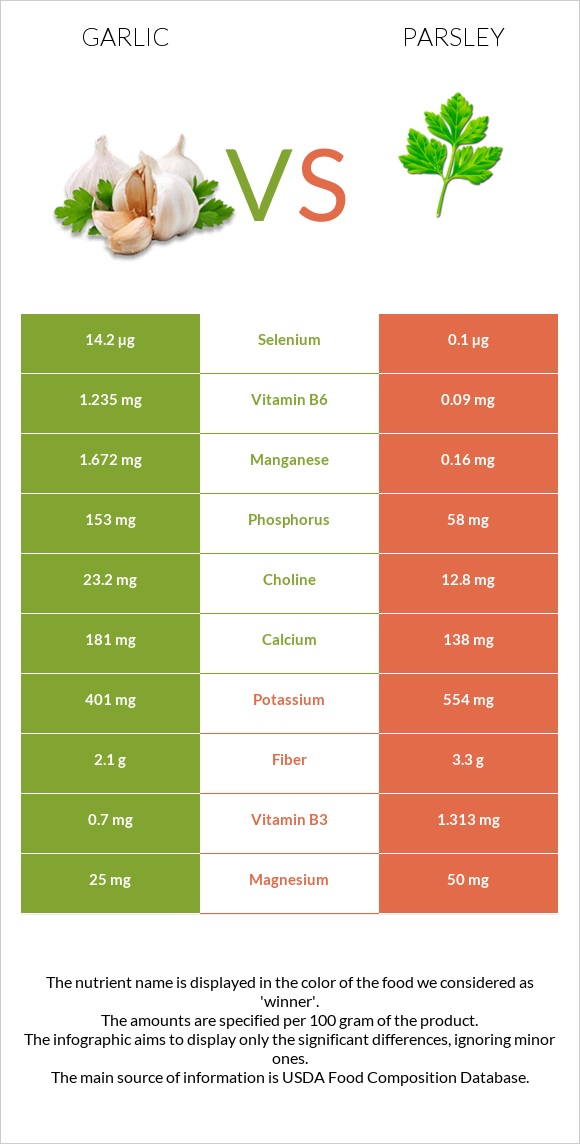
Important differences between garlic and parsley Garlic has more vitamin B6, manganese, selenium, copper, and phosphorus; however, parsley has more vitamin K, vitamin A, vitamin C, iron, and folate. Parsley's daily need coverage for vitamin K is 1365% more. Garlic has 142 times more selenium than parsley. Garlic has 14.2µg of selenium, while parsley has 0.1µg. The food varieties used in the comparison are Garlic, raw and Parsley, fresh .
Infographic
Mineral Comparison
Mineral comparison score is based on the number of minerals by which one or the other food is richer. The "coverage" charts below show how much of the daily needs can be covered by 300 grams of the food.
6
100 g
300 g
1 tsp - 2.8g 1 clove - 3g 3 cloves - 9g 1 cup - 136g
Magnesium
Magnesium
Calcium
Calcium
Potassium
Potassium
Iron
Iron
Copper
Copper
Zinc
Zinc
Phosphorus
Phosphorus
Sodium
Sodium
Manganese
Manganese
Selenium
Selenium
18%
54%
35%
64%
100%
32%
66%
2.2%
218%
77%
3
100 g
300 g
1 tbsp - 3.8g 10 sprigs - 10g 1 cup chopped - 60g
Magnesium
Magnesium
Calcium
Calcium
Potassium
Potassium
Iron
Iron
Copper
Copper
Zinc
Zinc
Phosphorus
Phosphorus
Sodium
Sodium
Manganese
Manganese
Selenium
Selenium
36%
41%
49%
233%
50%
29%
25%
7.3%
21%
0.55%
Vitamin Comparison
Vitamin comparison score is based on the number of vitamins by which one or the other food is richer. The "coverage" charts below show how much of the daily needs can be covered by 300 grams of the food.
4
100 g
300 g
1 tsp - 2.8g 1 clove - 3g 3 cloves - 9g 1 cup - 136g
Vitamin C
Vit. C
Vitamin D
Vit. D
Vitamin A
Vit. A
Vitamin E
Vit. E
Vitamin B1
Vit. B1
Vitamin B2
Vit. B2
Vitamin B3
Vit. B3
Vitamin B5
Vit. B5
Vitamin B6
Vit. B6
Vitamin B12
Vit. B12
Vitamin K
Vit. K
Folate
Folate
104%
0%
0%
1.6%
50%
25%
13%
36%
285%
0%
4.3%
2.3%
6
100 g
300 g
1 tbsp - 3.8g 10 sprigs - 10g 1 cup chopped - 60g
Vitamin C
Vit. C
Vitamin D
Vit. D
Vitamin A
Vit. A
Vitamin E
Vit. E
Vitamin B1
Vit. B1
Vitamin B2
Vit. B2
Vitamin B3
Vit. B3
Vitamin B5
Vit. B5
Vitamin B6
Vit. B6
Vitamin B12
Vit. B12
Vitamin K
Vit. K
Folate
Folate
443%
0%
140%
15%
22%
23%
25%
24%
21%
0%
4100%
114%
All nutrients comparison - raw data values
Nutrient
DV% diff.
Vitamin K
1.7µg
1640µg
1365%
Vitamin C
31.2mg
133mg
113%
Vitamin B6
1.235mg
0.09mg
88%
Manganese
1.672mg
0.16mg
66%
Iron
1.7mg
6.2mg
56%
Vitamin A
0µg
421µg
47%
Folate
3µg
152µg
37%
Selenium
14.2µg
0.1µg
26%
Copper
0.299mg
0.149mg
17%
Phosphorus
153mg
58mg
14%
Vitamin B1
0.2mg
0.086mg
10%
Carbs
33.06g
6.33g
9%
Protein
6.36g
2.97g
7%
Calories
149kcal
36kcal
6%
Magnesium
25mg
50mg
6%
Potassium
401mg
554mg
5%
Fiber
2.1g
3.3g
5%
Calcium
181mg
138mg
4%
Vitamin E
0.08mg
0.75mg
4%
Vitamin B3
0.7mg
1.313mg
4%
Vitamin B5
0.596mg
0.4mg
4%
Sodium
17mg
56mg
2%
Choline
23.2mg
12.8mg
2%
Zinc
1.16mg
1.07mg
1%
Vitamin B2
0.11mg
0.098mg
1%
Monounsaturated fat
0.011g
0.295g
1%
Polyunsaturated fat
0.249g
0.124g
1%
Protein per 100 calories
4.3g
8.3g
N/A
Calories per 10 g protein
234kcal
121kcal
N/A
Weight per 100 calories
67g
278g
N/A
Fats
0.5g
0.79g
0%
Net carbs
30.96g
3.03g
N/A
Sugar
1g
0.85g
N/A
Saturated fat
0.089g
0.132g
0%
Tryptophan
0.066mg
0.045mg
0%
Threonine
0.157mg
0.122mg
0%
Isoleucine
0.217mg
0.118mg
0%
Leucine
0.308mg
0.204mg
0%
Lysine
0.273mg
0.181mg
0%
Methionine
0.076mg
0.042mg
0%
Phenylalanine
0.183mg
0.145mg
0%
Valine
0.291mg
0.172mg
0%
Histidine
0.113mg
0.061mg
0%
Macronutrient Comparison
Macronutrient breakdown side-by-side comparison
2
6%
33%
59%
Protein:
6.36 g
Fats:
0.5 g
Carbs:
33.06 g
Water:
58.58 g
Other:
1.5 g
3
3%
6%
88%
2%
Protein:
2.97 g
Fats:
0.79 g
Carbs:
6.33 g
Water:
87.71 g
Other:
2.2 g
Contains
more
Protein Protein
+114.1%
Contains
more
Carbs Carbs
+422.3%
Contains
more
Fats Fats
+58%
Contains
more
Water Water
+49.7%
Contains
more
Other Other
+46.7%
Fat Type Comparison
Fat type breakdown side-by-side comparison
2
26%
3%
71%
Saturated fat:
Sat. Fat
0.089 g
Monounsaturated fat:
Mono. Fat
0.011 g
Polyunsaturated fat:
Poly. Fat
0.249 g
1
24%
54%
23%
Saturated fat:
Sat. Fat
0.132 g
Monounsaturated fat:
Mono. Fat
0.295 g
Polyunsaturated fat:
Poly. Fat
0.124 g
Contains
less
Sat. Fat Saturated fat
-32.6%
Contains
more
Poly. Fat Polyunsaturated fat
+100.8%
Contains
more
Mono. Fat Monounsaturated fat
+2581.8%