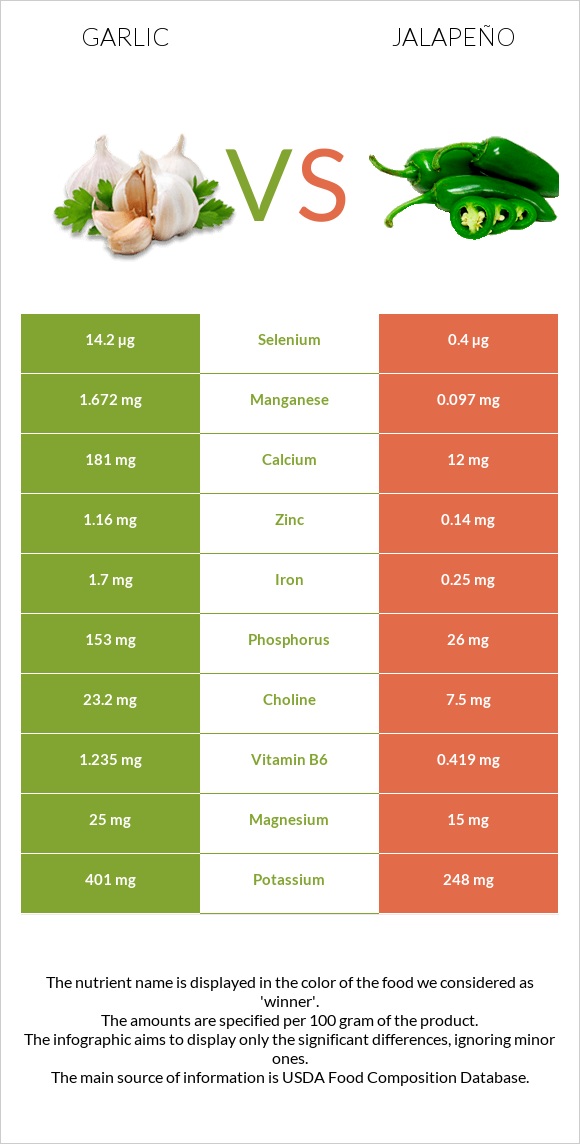
The main differences between garlic and jalapeño Garlic is richer in manganese, vitamin B6, copper, selenium, phosphorus, iron, and calcium, yet jalapeño is richer in vitamin C, vitamin E, and vitamin A. Daily need coverage for vitamin C for jalapeño is 97% higher. Garlic contains 36 times more selenium than jalapeño. Garlic contains 14.2µg of selenium, while jalapeño contains 0.4µg. Food types used in this article are Garlic, raw and Peppers, jalapeno, raw .
Infographic
Mineral Comparison
Mineral comparison score is based on the number of minerals by which one or the other food is richer. The "coverage" charts below show how much of the daily needs can be covered by 300 grams of the food.
9
100 g
300 g
1 tsp - 2.8g 1 clove - 3g 3 cloves - 9g 1 cup - 136g
Magnesium
Magnesium
Calcium
Calcium
Potassium
Potassium
Iron
Iron
Copper
Copper
Zinc
Zinc
Phosphorus
Phosphorus
Sodium
Sodium
Manganese
Manganese
Selenium
Selenium
18%
54%
35%
64%
100%
32%
66%
2.2%
218%
77%
1
100 g
300 g
1 pepper - 14g 1 cup, sliced - 90g
Magnesium
Magnesium
Calcium
Calcium
Potassium
Potassium
Iron
Iron
Copper
Copper
Zinc
Zinc
Phosphorus
Phosphorus
Sodium
Sodium
Manganese
Manganese
Selenium
Selenium
11%
3.6%
22%
9.4%
15%
3.8%
11%
0.39%
13%
2.2%
Vitamin Comparison
Vitamin comparison score is based on the number of vitamins by which one or the other food is richer. The "coverage" charts below show how much of the daily needs can be covered by 300 grams of the food.
4
100 g
300 g
1 tsp - 2.8g 1 clove - 3g 3 cloves - 9g 1 cup - 136g
Vitamin C
Vit. C
Vitamin D
Vit. D
Vitamin A
Vit. A
Vitamin E
Vit. E
Vitamin B1
Vit. B1
Vitamin B2
Vit. B2
Vitamin B3
Vit. B3
Vitamin B5
Vit. B5
Vitamin B6
Vit. B6
Vitamin B12
Vit. B12
Vitamin K
Vit. K
Folate
Folate
104%
0%
0%
1.6%
50%
25%
13%
36%
285%
0%
4.3%
2.3%
6
100 g
300 g
1 pepper - 14g 1 cup, sliced - 90g
Vitamin C
Vit. C
Vitamin D
Vit. D
Vitamin A
Vit. A
Vitamin E
Vit. E
Vitamin B1
Vit. B1
Vitamin B2
Vit. B2
Vitamin B3
Vit. B3
Vitamin B5
Vit. B5
Vitamin B6
Vit. B6
Vitamin B12
Vit. B12
Vitamin K
Vit. K
Folate
Folate
395%
0%
18%
72%
10%
16%
24%
19%
97%
0%
46%
20%
All nutrients comparison - raw data values
Nutrient
DV% diff.
Vitamin C
31.2mg
118.6mg
97%
Manganese
1.672mg
0.097mg
68%
Vitamin B6
1.235mg
0.419mg
63%
Copper
0.299mg
0.046mg
28%
Selenium
14.2µg
0.4µg
25%
Vitamin E
0.08mg
3.58mg
23%
Iron
1.7mg
0.25mg
18%
Phosphorus
153mg
26mg
18%
Calcium
181mg
12mg
17%
Vitamin K
1.7µg
18.5µg
14%
Vitamin B1
0.2mg
0.04mg
13%
Protein
6.36g
0.91g
11%
Carbs
33.06g
6.5g
9%
Zinc
1.16mg
0.14mg
9%
Calories
149kcal
29kcal
6%
Vitamin A
0µg
54µg
6%
Vitamin B5
0.596mg
0.315mg
6%
Folate
3µg
27µg
6%
Potassium
401mg
248mg
5%
Vitamin B3
0.7mg
1.28mg
4%
Fiber
2.1g
2.8g
3%
Vitamin B2
0.11mg
0.07mg
3%
Choline
23.2mg
7.5mg
3%
Fructose
2.63g
3%
Magnesium
25mg
15mg
2%
Sodium
17mg
3mg
1%
Polyunsaturated fat
0.249g
0.112g
1%
Protein per 100 calories
4.3g
3.1g
N/A
Calories per 10 g protein
234kcal
319kcal
N/A
Weight per 100 calories
67g
345g
N/A
Fats
0.5g
0.37g
0%
Net carbs
30.96g
3.7g
N/A
Sugar
1g
4.12g
N/A
Saturated fat
0.089g
0.092g
0%
Monounsaturated fat
0.011g
0.029g
0%
Tryptophan
0.066mg
0%
Threonine
0.157mg
0%
Isoleucine
0.217mg
0%
Leucine
0.308mg
0%
Lysine
0.273mg
0%
Methionine
0.076mg
0%
Phenylalanine
0.183mg
0%
Valine
0.291mg
0%
Histidine
0.113mg
0%
Omega-3 - ALA
0.05g
N/A
Omega-6 - Linoleic acid
0.062g
N/A
Macronutrient Comparison
Macronutrient breakdown side-by-side comparison
4
6%
33%
59%
Protein:
6.36 g
Fats:
0.5 g
Carbs:
33.06 g
Water:
58.58 g
Other:
1.5 g
1
7%
92%
Protein:
0.91 g
Fats:
0.37 g
Carbs:
6.5 g
Water:
91.69 g
Other:
0.53 g
Contains
more
Protein Protein
+598.9%
Contains
more
Fats Fats
+35.1%
Contains
more
Carbs Carbs
+408.6%
Contains
more
Other Other
+183%
Contains
more
Water Water
+56.5%
Fat Type Comparison
Fat type breakdown side-by-side comparison
2
26%
3%
71%
Saturated fat:
Sat. Fat
0.089 g
Monounsaturated fat:
Mono. Fat
0.011 g
Polyunsaturated fat:
Poly. Fat
0.249 g
1
39%
12%
48%
Saturated fat:
Sat. Fat
0.092 g
Monounsaturated fat:
Mono. Fat
0.029 g
Polyunsaturated fat:
Poly. Fat
0.112 g
Contains
more
Poly. Fat Polyunsaturated fat
+122.3%
Contains
more
Mono. Fat Monounsaturated fat
+163.6%
~equal in
Saturated fat
~0.092g