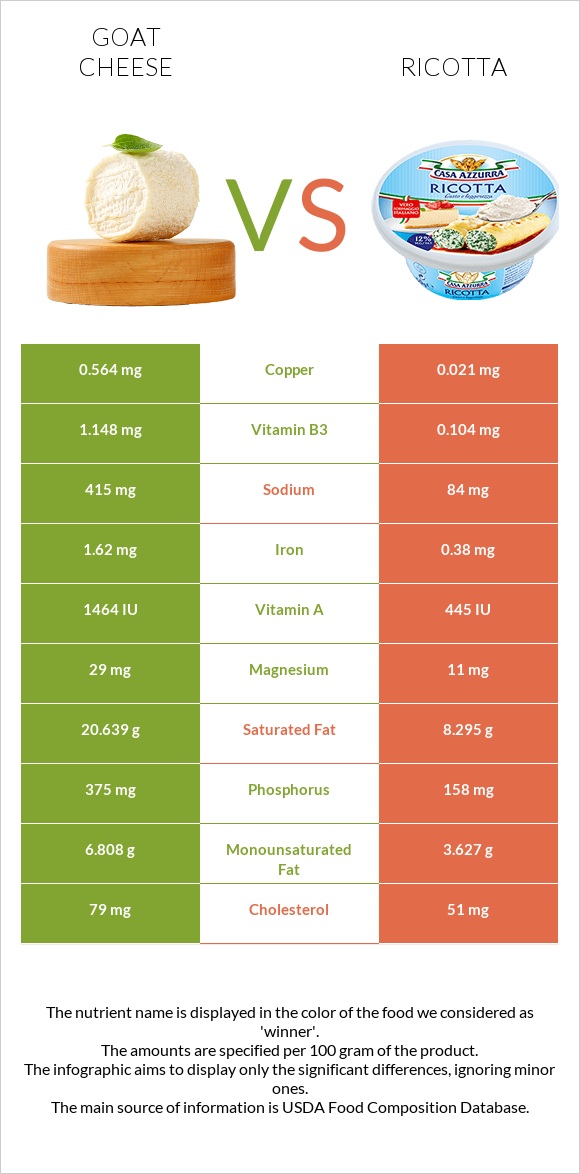
Goat cheese vs. Ricotta — Health Impact and Nutrition Comparison


Summary
Goat cheese is higher in calcium, copper, manganese, potassium, phosphorus, magnesium, iron, protein, and monounsaturated and polyunsaturated fats. Goat cheese has more vitamins B1, B2, B3, B6, A, D, and E. Ricotta has more carbs, zinc, choline, selenium, folate, and vitamins B5 and B12. Moreover, ricotta has fewer calories, cholesterol, saturated fats, and sodium.
Table of contents
Introduction
Goat cheese and ricotta are types of cheese, although they differ in ingredients, flavor, texture, and manufacturing processes. Here, we will discuss the differences.
Nutrition
In this part of the article, we will compare the nutritional values of goat cheese and ricotta, concentrating on differences.
Macronutrients and Calories
Goat cheese is denser compared to ricotta. Goat cheese contains 46% water, whereas ricotta has 72% water.
Macronutrient Comparison
Contains
more
ProteinProtein
+91.7%
Contains
more
FatsFats
+129.9%
Contains
more
OtherOther
+188.2%
Contains
more
CarbsCarbs
+2433.3%
Contains
more
WaterWater
+57.5%
Calories
Compared to ricotta, goat cheese has two times more calories. A hundred grams of goat cheese has 364 calories, whereas ricotta provides 174 calories.
Protein
Goat cheese has more protein compared to ricotta. A hundred grams of goat cheese provides 21.58g of protein, whereas ricotta has only 11.26g.
Fats
Goat cheese and ricotta provide high amounts of fats. In a 100g serving, goat cheese and ricotta have 29.84g and 12.98g of total fat, respectively. Goat cheese provides more monounsaturated and polyunsaturated fat, whereas ricotta has 2.5 times less saturated fat.
Fat Type Comparison
Contains
more
Mono. FatMonounsaturated fat
+87.7%
Contains
more
Poly. FatPolyunsaturated fat
+84.2%
Contains
less
Sat. FatSaturated fat
-59.8%
Carbohydrates
Both are not good sources of carbs. Compared to goat cheese, ricotta has over 25 times more carbs. A hundred grams of goat chees has 0.12g of net carbs, whereas ricotta has 3.04g.
Cholesterol
Goat cheese has more cholesterol. In a 100g serving, goat cheese and ricotta have 79mg and 51mg of cholesterol, respectively.
Vitamins
Goat cheese has over 5.5 times more vitamin B1 (thiamine), 3.5 times more vitamin B2 (riboflavin), 11 times more vitamin B3 (niacin), and 1.4 times more vitamin B6.
Unlike it, ricotta has more vitamin B5 and 1.5 times more vitamin B12. Goat cheese provides three times more vitamin A, 2.5 times more vitamin D, 2.2 times more vitamin K, and 2.4 times more vitamin E, whereas ricotta has six times more folate. In a 100g serving, goat cheese and ricotta have 1464IU and 445IU of vitamin A, respectively.
Vitamin Comparison
Contains
more
Vitamin DVitamin D
+150%
Contains
more
Vitamin AVitamin A
+239.2%
Contains
more
Vitamin EVitamin E
+136.4%
Contains
more
Vitamin B1Vitamin B1
+453.8%
Contains
more
Vitamin B2Vitamin B2
+246.7%
Contains
more
Vitamin B3Vitamin B3
+1003.8%
Contains
more
Vitamin B6Vitamin B6
+39.5%
Contains
more
Vitamin KVitamin K
+127.3%
Contains
more
Vitamin B5Vitamin B5
+12.1%
Contains
more
Vitamin B12Vitamin B12
+54.5%
Contains
more
FolateFolate
+500%
Minerals
Goat cheese has more calcium, copper, manganese, and potassium. It also provides two times more phosphorus, 2.5 times more magnesium, and four times more iron. In contrast, ricotta has more zinc, choline, and over four times more selenium. Ricotta provides over five times less sodium. In a 100g serving, goat cheese and ricotta have 415mg and 84mg of sodium, respectively.
Mineral Comparison
Contains
more
MagnesiumMagnesium
+163.6%
Contains
more
CalciumCalcium
+44%
Contains
more
PotassiumPotassium
+50.5%
Contains
more
IronIron
+326.3%
Contains
more
CopperCopper
+2585.7%
Contains
more
PhosphorusPhosphorus
+137.3%
Contains
more
ManganeseManganese
+1450%
Contains
more
ZincZinc
+75.8%
Contains
less
SodiumSodium
-79.8%
Contains
more
SeleniumSelenium
+281.6%
Oxalate content
Animal products like goat cheese and ricotta are oxalate-free.
Glycemic Index
The glycemic index of goat cheese is equal to 0. Ricotta cheese has a glycemic index of 27. Ricotta tends to have a higher glycemic index than goat cheese. However, the glycemic index of both falls in the low category.
Acidity
The potential renal acid load (PRAL) is a method for measuring a food's acidity. The PRAL number reflects the food's capacity to break down into acids or bases within the body. Goat cheese has a PRAL value of 16.5. The PRAL level for ricotta is 6.2. That indicates that goat cheese is more acid-forming than ricotta.
Weight Loss & Diets
Vegan: Vegans avoid all animal products such as dairy products, eggs, meat, fish, and other foods.
Vegetarian: A vegetarian diet excludes meat, poultry, and fish, but it allows for the consumption of dairy products and eggs. Goat cheese and ricotta are suitable for vegetarians.
Keto: The keto diet includes low-carb, high-fat, and high-protein foods. Goat cheese and ricotta are keto-friendly.
Paleo: The paleo diet focuses on eating unprocessed, natural foods and avoiding processed foods. Goat cheese and ricotta can be part of this diet.
Health Impact
Cardiovascular Health
There is strong evidence that consuming a moderate amount of dairy cheese, particularly goat cheese and ricotta, significantly reduces the risks of cardiovascular disease (1,2,3).
According to the study, consuming goat cheese may increase levels of "good" HDL cholesterol in the blood. However, it remains uncertain whether ricotta cheese has the same effect (4).
Additionally, goat cheese contains proteins with ACE inhibitory activities, similar to antihypertensive medications like Captopril and Lisinopril (5).
It should be noted that people taking MAO inhibitors (particularly antidepressants) may experience a hypertensive crisis when eating cheeses, including goat cheese and ricotta, which contain tyramine, which is the main amine in cheese (6).
Diabetes
Overall, there is a negative association between cheese and low-fat dairy product consumption and the risk of Type 2 Diabetes (7).
Choosing foods with a low glycemic index (GI) may help regulate postprandial glycemia, leading to more stable blood glucose levels. Additionally, opting for low-GI foods may contribute to reduced weight gain in individuals with prediabetes or diabetes. Given its lower GI, goat cheese is preferable for individuals with Type 2 Diabetes (8).
Cancer
Studies found that cheese intake is inversely associated with the risk of prostate cancer, breast cancer, and colorectal cancer (9).
There is low association with lung, gastric, colorectal, colon (total and distal), rectal, bladder, and pancreatic cancers, and cheese consumption. According to the study, there is an inverse correlation between ricotta cheese eating and ER−negative (estrogen receptor) breast cancer incidence (10).
Goat cheese consumption may prevent the proliferation of leukemic cells (11).
Lactose Allergy
Dairy products like goat cheese and ricotta may be allergic to people. Cow milk found in ricotta can cause allergic reactions such as wheezing, vomiting, abdominal cramps, flushing, and anaphylaxis. Goat and sheep's milk have proteins similar to cow's milk, so if you are allergic to cow's milk, you should avoid goat cheese and ricotta (12.13).
Lactose Intolerance
Lactose-intolerant people lack lactase, an enzyme that digests lactose found in dairy products. Goat and cow milk contain lactose, so lactose-intolerant people should avoid ricotta and goat cheese (14).
Classification
Goat cheese is a type of cheese that is made from goat's milk. On the other hand, ricotta is typically made from cow's milk, but it can also be made using sheep's milk or a combination of these kinds of milk.
Goat cheese originates in the Mediterranean and Middle Eastern regions. Ricotta is a traditional Italian cheese.
Appearance
Fresh goat cheese is white or off-white, whereas aged varieties are slightly golden or beige. Ricotta is often white or off-white, but the color might vary somewhat based on the kind of milk used.
Goat cheese varies in texture, ranging from soft and creamy to firm and crumbly, based on the type and age. Ricotta has a gritty, creamy texture and a light and fluffy consistency.
Some goat cheeses may have a natural or edible rind, whereas others come without it. Depending on the type of goat cheese, the rind may be smooth, wrinkled, or covered with herbs, ash, or spices. Ricotta, on the other hand, is a fresh cheese that often lacks a rind. It is served in its creamy, unripened condition.
Unlike other older cheeses, ricotta lacks a characteristic mold. It comes in containers or tubs. Goat cheese has different shapes, including logs, rounds, pyramids, and other molded forms.
Taste and Use
The taste of goat cheese can vary depending on the type of milk used. It has a tangy flavor. Ricotta has a moderate sweet taste. It is commonly used in savory and sweet dishes and may absorb the flavors of other ingredients.
You can use goat cheese in salads, pizzas, appetizers, and as a spread for toast or crackers. You can use ricotta cheese in dishes like lasagna, cannoli, and filled pasta.
Varieties
Rricotta is available in different forms: the most common types are ricotta di mucca (cow milk ricotta), ricotta di pecora (sheep milk ricotta), and ricotta mista di mucca e pecora (a mixture of cow and sheep milk ricottas).
There are several regional and artisanal goat cheese variations, each with distinct features. Fresh Goat Cheese (Chevre), Crottin, Bucheron, and Pico are common types of goat cheese.
Sources
- https://www.ncbi.nlm.nih.gov/pmc/articles/PMC9318947/
- https://www.sciencedirect.com/science/article/pii/S2161831323013285
- https://www.ncbi.nlm.nih.gov/pmc/articles/PMC9142774/
- https://pubmed.ncbi.nlm.nih.gov/32380746
- https://www.tandfonline.com/doi/full/10.1080/19476337.2016.1202325
- https://europepmc.org/article/med/3283290
- https://pubmed.ncbi.nlm.nih.gov/23945722/
- https://pubmed.ncbi.nlm.nih.gov/31374573/
- https://www.ncbi.nlm.nih.gov/pmc/articles/PMC10509445/
- https://pubmed.ncbi.nlm.nih.gov/33964859/
- https://pubmed.ncbi.nlm.nih.gov/22541454/
- https://www.rch.org.au/uploadedFiles/Main/Content/allergy/Cows%20milk%20allergy.pdf
- https://www.ncbi.nlm.nih.gov/books/NBK542243/
- https://foodallergytest.co.uk/product/goats-milk-allergy-test

Infographic
All nutrients comparison - raw data values
| Nutrient | |
|
DV% diff. |
| Copper | 0.564mg | 0.021mg | 60% |
| Saturated fat | 20.639g | 8.295g | 56% |
| Vitamin B2 | 0.676mg | 0.195mg | 37% |
| Vitamin A | 407µg | 120µg | 32% |
| Phosphorus | 375mg | 158mg | 31% |
| Fats | 29.84g | 12.98g | 26% |
| Protein | 21.58g | 11.26g | 21% |
| Selenium | 3.8µg | 14.5µg | 19% |
| Iron | 1.62mg | 0.38mg | 16% |
| Sodium | 415mg | 84mg | 14% |
| Calories | 364kcal | 174kcal | 10% |
| Cholesterol | 79mg | 51mg | 9% |
| Calcium | 298mg | 207mg | 9% |
| Monounsaturated fat | 6.808g | 3.627g | 8% |
| Vitamin B3 | 1.148mg | 0.104mg | 7% |
| Zinc | 0.66mg | 1.16mg | 5% |
| Vitamin B1 | 0.072mg | 0.013mg | 5% |
| Vitamin B12 | 0.22µg | 0.34µg | 5% |
| Magnesium | 29mg | 11mg | 4% |
| Manganese | 0.093mg | 0.006mg | 4% |
| Folate | 2µg | 12µg | 3% |
| Vitamin D* | 22 IU | 10 IU | 2% |
| Vitamin D | 0.5µg | 0.2µg | 2% |
| Potassium | 158mg | 105mg | 2% |
| Polyunsaturated fat | 0.709g | 0.385g | 2% |
| Carbs | 0.12g | 3.04g | 1% |
| Vitamin E | 0.26mg | 0.11mg | 1% |
| Vitamin B6 | 0.06mg | 0.043mg | 1% |
| Vitamin K | 2.5µg | 1.1µg | 1% |
| Protein per 100 calories | 5.9g | 6.5g | N/A |
| Calories per 10 g protein | 169kcal | 155kcal | N/A |
| Weight per 100 calories | 27g | 57g | N/A |
| Unsaturated / Saturated Fat ratio | 0.36 | 0.48 | N/A |
| Net carbs | 0.12g | 3.04g | N/A |
| Sugar | 0.12g | 0.27g | N/A |
| Vitamin B5 | 0.19mg | 0.213mg | 0% |
| Choline | 15.4mg | 17.5mg | 0% |
| Tryptophan | 0.227mg | 0.125mg | 0% |
| Threonine | 0.805mg | 0.517mg | 0% |
| Isoleucine | 0.893mg | 0.589mg | 0% |
| Leucine | 1.861mg | 1.221mg | 0% |
| Lysine | 1.549mg | 1.338mg | 0% |
| Methionine | 0.575mg | 0.281mg | 0% |
| Phenylalanine | 0.859mg | 0.556mg | 0% |
| Valine | 1.485mg | 0.692mg | 0% |
| Histidine | 0.589mg | 0.459mg | 0% |
People also compare


References
All the values for which the sources are not specified explicitly are taken from FDA’s Food Central. The exact link to the food presented on this page can be found below.
- Goat cheese - https://fdc.nal.usda.gov/fdc-app.html#/food-details/173433/nutrients
- Ricotta - https://fdc.nal.usda.gov/fdc-app.html#/food-details/170851/nutrients
All the Daily Values are presented for males aged 31-50, for 2000-calorie diets.