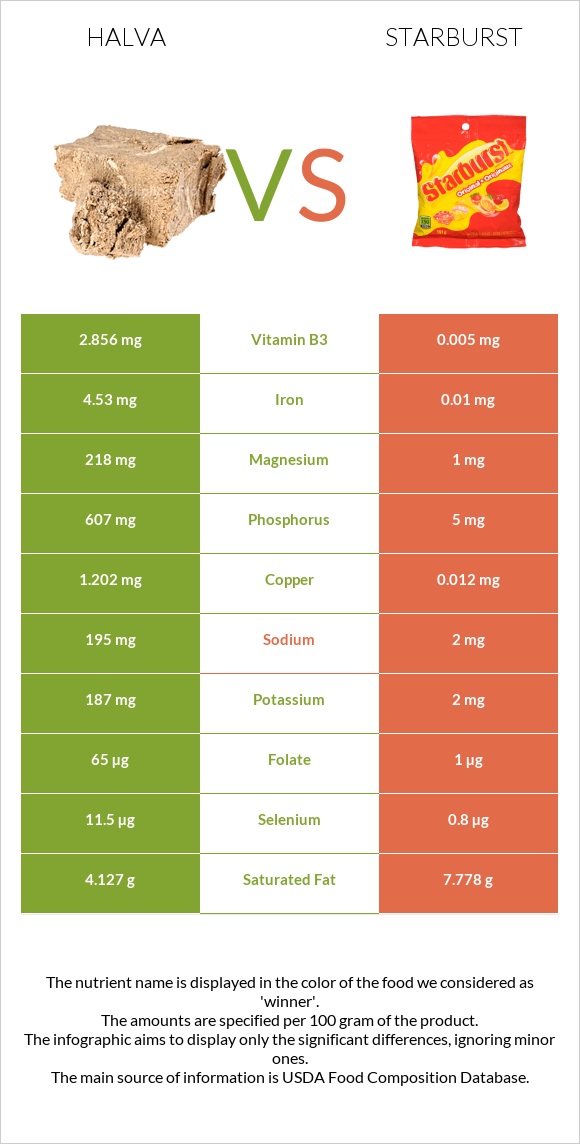
Summary of differences between halva and starburst Halva has more copper, phosphorus, iron, magnesium, zinc, manganese, vitamin B1, vitamin B6, and selenium; however, starburst is higher in vitamin C. Halva covers your daily need for copper, 132% more than starburst. These are the specific foods used in this comparison Candies, halavah, plain and Candies, MARS SNACKFOOD US, STARBURST Fruit Chews, Original fruits .
Infographic
Mineral Comparison
Mineral comparison score is based on the number of minerals by which one or the other food is richer. The "coverage" charts below show how much of the daily needs can be covered by 300 grams of the food.
9
100 g
300 g
1 oz - 28.35g
Magnesium
Magnesium
Calcium
Calcium
Potassium
Potassium
Iron
Iron
Copper
Copper
Zinc
Zinc
Phosphorus
Phosphorus
Sodium
Sodium
Manganese
Manganese
Selenium
Selenium
156%
9.9%
17%
170%
401%
118%
260%
25%
114%
63%
1
100 g
300 g
1 piece - 5g 1 serving fun size (8 chews) - 40g 1 serving 2.07 oz pack - 59g
Magnesium
Magnesium
Calcium
Calcium
Potassium
Potassium
Iron
Iron
Copper
Copper
Zinc
Zinc
Phosphorus
Phosphorus
Sodium
Sodium
Manganese
Manganese
Selenium
Selenium
0.71%
0%
0.18%
0.38%
4%
0%
2.1%
0.26%
2%
4.4%
Vitamin Comparison
Vitamin comparison score is based on the number of vitamins by which one or the other food is richer. The "coverage" charts below show how much of the daily needs can be covered by 300 grams of the food.
7
100 g
300 g
1 oz - 28.35g
Vitamin C
Vit. C
Vitamin D
Vit. D
Vitamin A
Vit. A
Vitamin E
Vit. E
Vitamin B1
Vit. B1
Vitamin B2
Vit. B2
Vitamin B3
Vit. B3
Vitamin B5
Vit. B5
Vitamin B6
Vit. B6
Vitamin B12
Vit. B12
Vitamin K
Vit. K
Folate
Folate
0.33%
0%
0%
0%
106%
20%
54%
10%
80%
5%
0%
49%
3
100 g
300 g
1 piece - 5g 1 serving fun size (8 chews) - 40g 1 serving 2.07 oz pack - 59g
Vitamin C
Vit. C
Vitamin D
Vit. D
Vitamin A
Vit. A
Vitamin E
Vit. E
Vitamin B1
Vit. B1
Vitamin B2
Vit. B2
Vitamin B3
Vit. B3
Vitamin B5
Vit. B5
Vitamin B6
Vit. B6
Vitamin B12
Vit. B12
Vitamin K
Vit. K
Folate
Folate
196%
0%
0%
6.6%
0.25%
0.46%
0.09%
2.1%
0%
0%
5.3%
0.75%
All nutrients comparison - raw data values
Nutrient
DV% diff.
Copper
1.202mg
0.012mg
132%
Phosphorus
607mg
5mg
86%
Vitamin C
0.1mg
58.7mg
65%
Iron
4.53mg
0.01mg
57%
Polyunsaturated fat
8.481g
0g
57%
Magnesium
218mg
1mg
52%
Zinc
4.32mg
0mg
39%
Manganese
0.873mg
0.015mg
37%
Vitamin B1
0.424mg
0.001mg
35%
Vitamin B6
0.348mg
0mg
27%
Protein
12.49g
0.41g
24%
Fats
21.52g
8.21g
20%
Monounsaturated fat
8.194g
0g
20%
Selenium
11.5µg
0.8µg
19%
Fiber
4.5g
0g
18%
Vitamin B3
2.856mg
0.005mg
18%
Saturated fat
4.127g
7.778g
17%
Folate
65µg
1µg
16%
Sodium
195mg
2mg
8%
Carbs
60.49g
82.57g
7%
Vitamin B2
0.088mg
0.002mg
7%
Potassium
187mg
2mg
5%
Calories
469kcal
408kcal
3%
Calcium
33mg
0mg
3%
Vitamin B5
0.174mg
0.035mg
3%
Vitamin E
0.33mg
2%
Vitamin B12
0.04µg
0µg
2%
Vitamin K
2.1µg
2%
Protein per 100 calories
2.7g
0.1g
N/A
Calories per 10 g protein
376kcal
9951kcal
N/A
Weight per 100 calories
21g
25g
N/A
Unsaturated / Saturated Fat ratio
4
0
N/A
Net carbs
55.99g
82.57g
N/A
Sugar
58.12g
N/A
Trans fat
0.141g
N/A
Macronutrient Comparison
Macronutrient breakdown side-by-side comparison
3
12%
22%
60%
4%
2%
Protein:
12.49 g
Fats:
21.52 g
Carbs:
60.49 g
Water:
3.67 g
Other:
1.83 g
2
8%
83%
9%
Protein:
0.41 g
Fats:
8.21 g
Carbs:
82.57 g
Water:
8.51 g
Other:
0.3 g
Contains
more
Protein Protein
+2946.3%
Contains
more
Fats Fats
+162.1%
Contains
more
Other Other
+510%
Contains
more
Carbs Carbs
+36.5%
Contains
more
Water Water
+131.9%
Fat Type Comparison
Fat type breakdown side-by-side comparison
3
20%
39%
41%
Saturated fat:
Sat. Fat
4.127 g
Monounsaturated fat:
Mono. Fat
8.194 g
Polyunsaturated fat:
Poly. Fat
8.481 g
0
100%
Saturated fat:
Sat. Fat
7.778 g
Monounsaturated fat:
Mono. Fat
0 g
Polyunsaturated fat:
Poly. Fat
0 g
Contains
less
Sat. Fat Saturated fat
-46.9%
Contains
more
Mono. Fat Monounsaturated fat
+∞%
Contains
more
Poly. Fat Polyunsaturated fat
+∞%