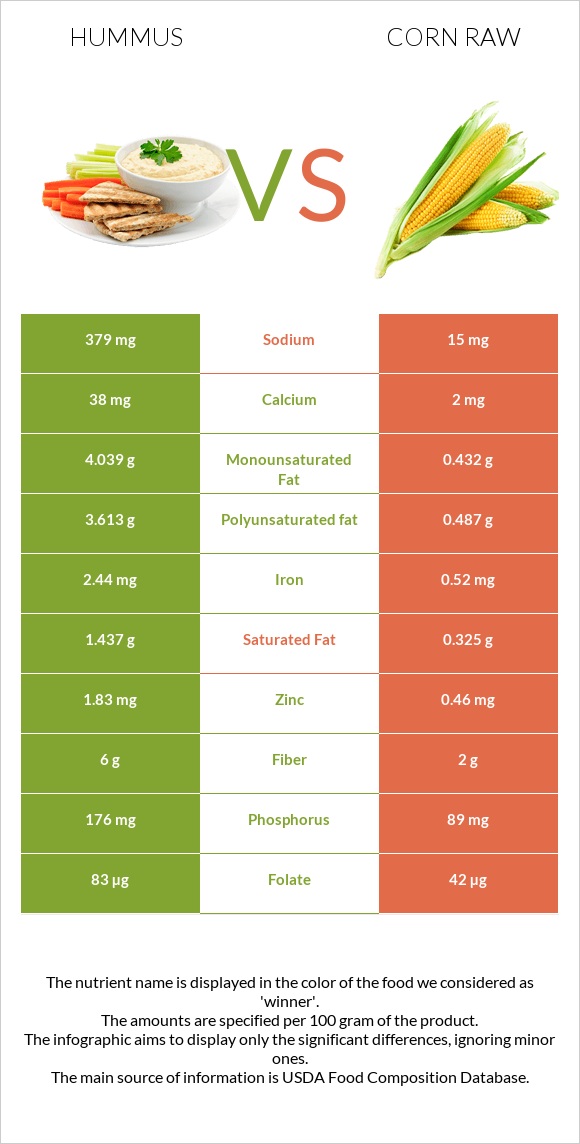
A recap on the differences between hummus and corn raw Hummus is higher in copper, manganese, iron, fiber, zinc, phosphorus, folate, and vitamin B6, yet corn raw is higher in vitamin B5. Hummus covers your daily copper needs 53% more than corn raw. Hummus contains 25 times more sodium than corn raw. While hummus contains 379mg of sodium, corn raw contains only 15mg. The glycemic index of hummus is lower. Food varieties used in this article are Hummus, commercial and Corn, sweet, yellow, raw .
Infographic
Mineral Comparison
Mineral comparison score is based on the number of minerals by which one or the other food is richer. The "coverage" charts below show how much of the daily needs can be covered by 300 grams of the food.
8
100 g
300 g
1 tbsp - 15g 1 cup - 246g
Magnesium
Magnesium
Calcium
Calcium
Potassium
Potassium
Iron
Iron
Copper
Copper
Zinc
Zinc
Phosphorus
Phosphorus
Sodium
Sodium
Manganese
Manganese
Selenium
Selenium
51%
11%
20%
92%
176%
50%
75%
49%
101%
14%
2
100 g
300 g
1 ear, small (5-1/2" to 6-1/2" long) - 73g 1 ear, medium (6-3/4" to 7-1/2" long) yields - 102g 1 ear, large (7-3/4" to 9" long) yields - 143g 1 cup - 145g
Magnesium
Magnesium
Calcium
Calcium
Potassium
Potassium
Iron
Iron
Copper
Copper
Zinc
Zinc
Phosphorus
Phosphorus
Sodium
Sodium
Manganese
Manganese
Selenium
Selenium
26%
0.6%
24%
20%
18%
13%
38%
2%
21%
3.3%
Vitamin Comparison
Vitamin comparison score is based on the number of vitamins by which one or the other food is richer. The "coverage" charts below show how much of the daily needs can be covered by 300 grams of the food.
4
100 g
300 g
1 tbsp - 15g 1 cup - 246g
Vitamin C
Vit. C
Vitamin D
Vit. D
Vitamin A
Vit. A
Vitamin E
Vit. E
Vitamin B1
Vit. B1
Vitamin B2
Vit. B2
Vitamin B3
Vit. B3
Vitamin B5
Vit. B5
Vitamin B6
Vit. B6
Vitamin B12
Vit. B12
Vitamin K
Vit. K
Folate
Folate
0%
0%
0%
0%
45%
15%
11%
7.9%
46%
0%
0%
62%
6
100 g
300 g
1 ear, small (5-1/2" to 6-1/2" long) - 73g 1 ear, medium (6-3/4" to 7-1/2" long) yields - 102g 1 ear, large (7-3/4" to 9" long) yields - 143g 1 cup - 145g
Vitamin C
Vit. C
Vitamin D
Vit. D
Vitamin A
Vit. A
Vitamin E
Vit. E
Vitamin B1
Vit. B1
Vitamin B2
Vit. B2
Vitamin B3
Vit. B3
Vitamin B5
Vit. B5
Vitamin B6
Vit. B6
Vitamin B12
Vit. B12
Vitamin K
Vit. K
Folate
Folate
23%
0%
3%
1.4%
39%
13%
33%
43%
21%
0%
0.75%
32%
All nutrients comparison - raw data values
Nutrient
DV% diff.
Copper
0.527mg
0.054mg
53%
Manganese
0.773mg
0.163mg
27%
Iron
2.44mg
0.52mg
24%
Polyunsaturated fat
3.613g
0.487g
21%
Fiber
6g
2g
16%
Sodium
379mg
15mg
16%
Fats
9.6g
1.35g
13%
Zinc
1.83mg
0.46mg
12%
Phosphorus
176mg
89mg
12%
Vitamin B5
0.132mg
0.717mg
12%
Folate
83µg
42µg
10%
Protein
7.9g
3.27g
9%
Monounsaturated fat
4.039g
0.432g
9%
Vitamin C
0mg
6.8mg
8%
Magnesium
71mg
37mg
8%
Vitamin B6
0.2mg
0.093mg
8%
Vitamin B3
0.582mg
1.77mg
7%
Saturated fat
1.437g
0.325g
5%
Calories
166kcal
86kcal
4%
Calcium
38mg
2mg
4%
Selenium
2.6µg
0.6µg
4%
Choline
23mg
4%
Starch
5.7g
2%
Vitamin B1
0.18mg
0.155mg
2%
Fructose
1.94g
2%
Carbs
14.29g
18.7g
1%
Potassium
228mg
270mg
1%
Vitamin A
9µg
1%
Vitamin B2
0.064mg
0.055mg
1%
Protein per 100 calories
4.8g
3.8g
N/A
Calories per 10 g protein
210kcal
263kcal
N/A
Weight per 100 calories
60g
116g
N/A
Unsaturated / Saturated Fat ratio
5.3
2.8
N/A
Net carbs
8.29g
16.7g
N/A
Sugar
6.26g
N/A
Vitamin E
0.07mg
0%
Vitamin K
0.3µg
0%
Tryptophan
0.023mg
0%
Threonine
0.129mg
0%
Isoleucine
0.129mg
0%
Leucine
0.348mg
0%
Lysine
0.137mg
0%
Methionine
0.067mg
0%
Phenylalanine
0.15mg
0%
Valine
0.185mg
0%
Histidine
0.089mg
0%
Omega-3 - ALA
0.014g
N/A
Omega-6 - Linoleic acid
0.468g
N/A
Macronutrient Comparison
Macronutrient breakdown side-by-side comparison
3
8%
10%
14%
67%
Protein:
7.9 g
Fats:
9.6 g
Carbs:
14.29 g
Water:
66.59 g
Other:
1.62 g
2
3%
19%
76%
Protein:
3.27 g
Fats:
1.35 g
Carbs:
18.7 g
Water:
76.05 g
Other:
0.63 g
Contains
more
Protein Protein
+141.6%
Contains
more
Fats Fats
+611.1%
Contains
more
Other Other
+157.1%
Contains
more
Carbs Carbs
+30.9%
Contains
more
Water Water
+14.2%
Fat Type Comparison
Fat type breakdown side-by-side comparison
2
16%
44%
40%
Saturated fat:
Sat. Fat
1.437 g
Monounsaturated fat:
Mono. Fat
4.039 g
Polyunsaturated fat:
Poly. Fat
3.613 g
1
26%
35%
39%
Saturated fat:
Sat. Fat
0.325 g
Monounsaturated fat:
Mono. Fat
0.432 g
Polyunsaturated fat:
Poly. Fat
0.487 g
Contains
more
Mono. Fat Monounsaturated fat
+835%
Contains
more
Poly. Fat Polyunsaturated fat
+641.9%
Contains
less
Sat. Fat Saturated fat
-77.4%