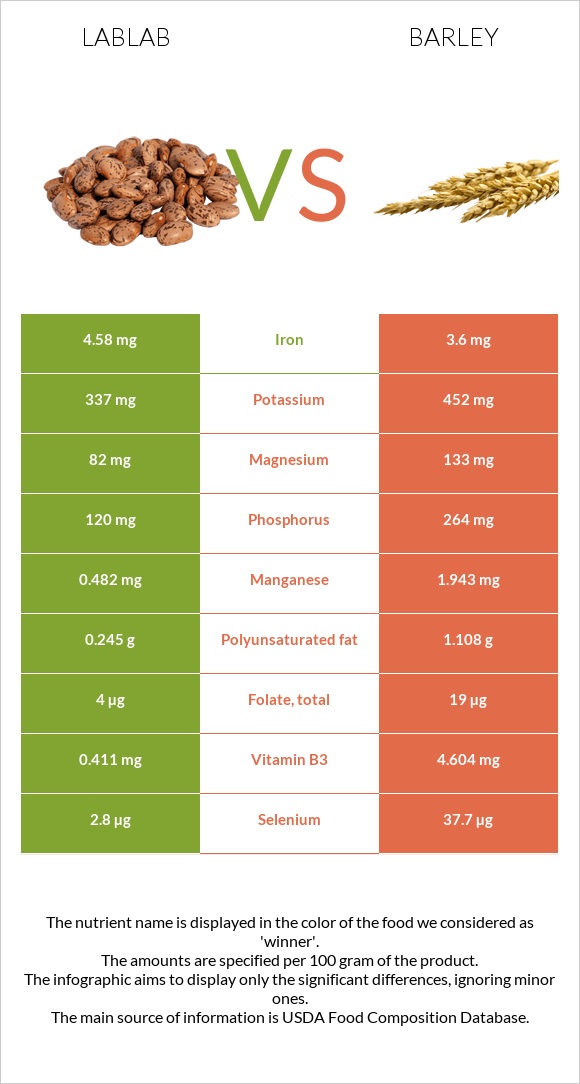
Important differences between lablab and barley Lablab has more iron; however, barley has more manganese, selenium, vitamin B1, vitamin B3, vitamin B6, phosphorus, vitamin B2, copper, and magnesium. Barley's daily need coverage for manganese is 64% more. Lablab has a higher glycemic index than barley. The food varieties used in the comparison are Hyacinth beans, mature seeds, cooked, boiled, without salt and Barley, hulled .
Infographic
Mineral Comparison
Mineral comparison score is based on the number of minerals by which one or the other food is richer. The "coverage" charts below show how much of the daily needs can be covered by 300 grams of the food.
3
100 g
300 g
1 cup - 194g
Magnesium
Magnesium
Calcium
Calcium
Potassium
Potassium
Iron
Iron
Copper
Copper
Zinc
Zinc
Phosphorus
Phosphorus
Sodium
Sodium
Manganese
Manganese
Selenium
Selenium
59%
12%
30%
172%
114%
78%
51%
0.91%
63%
15%
6
100 g
300 g
1 cup - 184g
Magnesium
Magnesium
Calcium
Calcium
Potassium
Potassium
Iron
Iron
Copper
Copper
Zinc
Zinc
Phosphorus
Phosphorus
Sodium
Sodium
Manganese
Manganese
Selenium
Selenium
95%
9.9%
40%
135%
166%
76%
113%
1.6%
253%
206%
Vitamin Comparison
Vitamin comparison score is based on the number of vitamins by which one or the other food is richer. The "coverage" charts below show how much of the daily needs can be covered by 300 grams of the food.
1
100 g
300 g
1 cup - 194g
Vitamin C
Vit. C
Vitamin D
Vit. D
Vitamin A
Vit. A
Vitamin E
Vit. E
Vitamin B1
Vit. B1
Vitamin B2
Vit. B2
Vitamin B3
Vit. B3
Vitamin B5
Vit. B5
Vitamin B6
Vit. B6
Vitamin B12
Vit. B12
Vitamin K
Vit. K
Folate
Folate
0%
0%
0%
0%
68%
8.5%
7.7%
19%
8.5%
0%
0%
3%
8
100 g
300 g
1 cup - 184g
Vitamin C
Vit. C
Vitamin D
Vit. D
Vitamin A
Vit. A
Vitamin E
Vit. E
Vitamin B1
Vit. B1
Vitamin B2
Vit. B2
Vitamin B3
Vit. B3
Vitamin B5
Vit. B5
Vitamin B6
Vit. B6
Vitamin B12
Vit. B12
Vitamin K
Vit. K
Folate
Folate
0%
0%
0.33%
11%
162%
66%
86%
17%
73%
0%
5.5%
14%
All nutrients comparison - raw data values
Nutrient
DV% diff.
Fiber
17.3g
69%
Manganese
0.482mg
1.943mg
64%
Selenium
2.8µg
37.7µg
63%
Vitamin B1
0.27mg
0.646mg
31%
Vitamin B3
0.411mg
4.604mg
26%
Vitamin B6
0.037mg
0.318mg
22%
Phosphorus
120mg
264mg
21%
Vitamin B2
0.037mg
0.285mg
19%
Carbs
20.69g
73.48g
18%
Copper
0.341mg
0.498mg
17%
Calories
117kcal
354kcal
12%
Magnesium
82mg
133mg
12%
Iron
4.58mg
3.6mg
12%
Protein
8.14g
12.48g
9%
Polyunsaturated fat
0.245g
1.108g
6%
Vitamin E
0.57mg
4%
Folate
4µg
19µg
4%
Fats
0.58g
2.3g
3%
Potassium
337mg
452mg
3%
Vitamin K
2.2µg
2%
Saturated fat
0.099g
0.482g
2%
Calcium
40mg
33mg
1%
Zinc
2.85mg
2.77mg
1%
Vitamin B5
0.316mg
0.282mg
1%
Monounsaturated fat
0.026g
0.295g
1%
Protein per 100 calories
7g
3.5g
N/A
Calories per 10 g protein
144kcal
284kcal
N/A
Weight per 100 calories
85g
28g
N/A
Unsaturated / Saturated Fat ratio
2.7
2.9
N/A
Net carbs
20.69g
56.18g
N/A
Sugar
0.8g
N/A
Sodium
7mg
12mg
0%
Vitamin A
0µg
1µg
0%
Tryptophan
0.068mg
0.208mg
0%
Threonine
0.315mg
0.424mg
0%
Isoleucine
0.39mg
0.456mg
0%
Leucine
0.691mg
0.848mg
0%
Lysine
0.556mg
0.465mg
0%
Methionine
0.065mg
0.24mg
0%
Phenylalanine
0.41mg
0.7mg
0%
Valine
0.422mg
0.612mg
0%
Histidine
0.233mg
0.281mg
0%
Macronutrient Comparison
Macronutrient breakdown side-by-side comparison
1
8%
21%
69%
Protein:
8.14 g
Fats:
0.58 g
Carbs:
20.69 g
Water:
69.13 g
Other:
1.46 g
4
12%
2%
73%
9%
2%
Protein:
12.48 g
Fats:
2.3 g
Carbs:
73.48 g
Water:
9.44 g
Other:
2.3 g
Contains
more
Water Water
+632.3%
Contains
more
Protein Protein
+53.3%
Contains
more
Fats Fats
+296.6%
Contains
more
Carbs Carbs
+255.1%
Contains
more
Other Other
+57.5%
Fat Type Comparison
Fat type breakdown side-by-side comparison
1
27%
7%
66%
Saturated fat:
Sat. Fat
0.099 g
Monounsaturated fat:
Mono. Fat
0.026 g
Polyunsaturated fat:
Poly. Fat
0.245 g
2
26%
16%
59%
Saturated fat:
Sat. Fat
0.482 g
Monounsaturated fat:
Mono. Fat
0.295 g
Polyunsaturated fat:
Poly. Fat
1.108 g
Contains
less
Sat. Fat Saturated fat
-79.5%
Contains
more
Mono. Fat Monounsaturated fat
+1034.6%
Contains
more
Poly. Fat Polyunsaturated fat
+352.2%