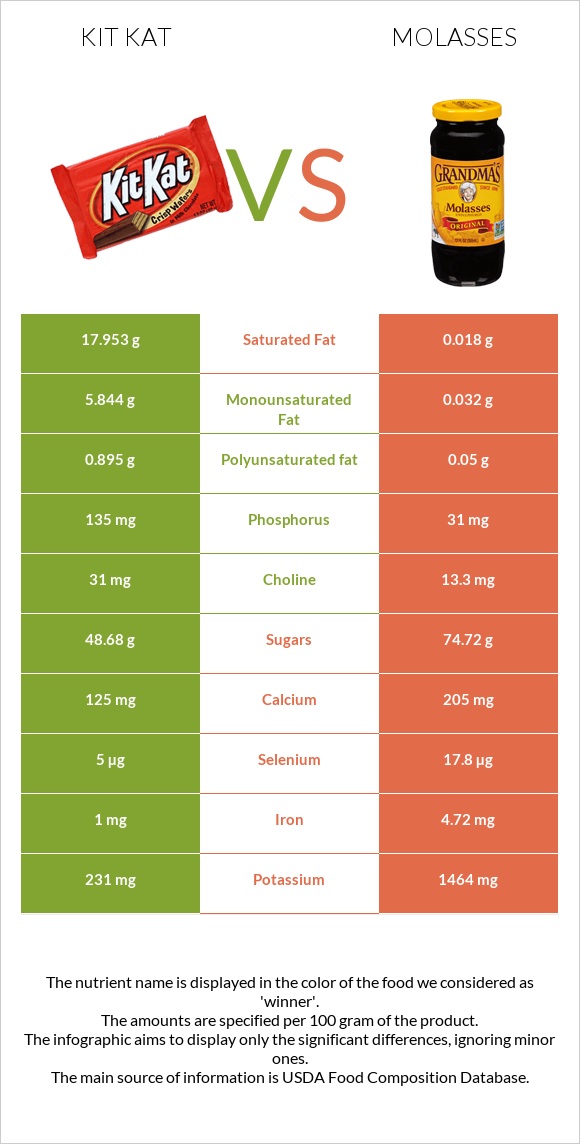
Summary of differences between kit Kat and molasses Kit Kat has more vitamin B12 and vitamin B2; however, molasses are higher in manganese, vitamin B6, magnesium, iron, potassium, copper, and selenium. Kit Kat covers your daily need for saturated fat, 90% more than molasses. Molasses have less saturated fat. These are the specific foods used in this comparison Candies, KIT KAT Wafer Bar and Molasses .
Infographic
Mineral Comparison
Mineral comparison score is based on the number of minerals by which one or the other food is richer. The "coverage" charts below show how much of the daily needs can be covered by 300 grams of the food.
1
100 g
300 g
1 bar, miniature (.35 oz) - 10g 1 bar (1.5 oz) - 42g 1 bar (1.625 oz) - 46g 1 bar (2.8 oz) - 78g 1 bar (3.375 oz) - 96g
Magnesium
Magnesium
Calcium
Calcium
Potassium
Potassium
Iron
Iron
Copper
Copper
Zinc
Zinc
Phosphorus
Phosphorus
Sodium
Sodium
Manganese
Manganese
Selenium
Selenium
26%
38%
20%
38%
73%
2.5%
58%
7%
13%
27%
9
100 g
300 g
1 serving 1 tbsp - 20g 1 cup - 337g
Magnesium
Magnesium
Calcium
Calcium
Potassium
Potassium
Iron
Iron
Copper
Copper
Zinc
Zinc
Phosphorus
Phosphorus
Sodium
Sodium
Manganese
Manganese
Selenium
Selenium
173%
62%
129%
177%
162%
7.9%
13%
4.8%
200%
97%
Vitamin Comparison
Vitamin comparison score is based on the number of vitamins by which one or the other food is richer. The "coverage" charts below show how much of the daily needs can be covered by 300 grams of the food.
7
100 g
300 g
1 bar, miniature (.35 oz) - 10g 1 bar (1.5 oz) - 42g 1 bar (1.625 oz) - 46g 1 bar (2.8 oz) - 78g 1 bar (3.375 oz) - 96g
Vitamin C
Vit. C
Vitamin D
Vit. D
Vitamin A
Vit. A
Vitamin E
Vit. E
Vitamin B1
Vit. B1
Vitamin B2
Vit. B2
Vitamin B3
Vit. B3
Vitamin B5
Vit. B5
Vitamin B6
Vit. B6
Vitamin B12
Vit. B12
Vitamin K
Vit. K
Folate
Folate
0%
0%
8%
6.8%
29%
48%
9.4%
38%
4.6%
70%
13%
11%
3
100 g
300 g
1 serving 1 tbsp - 20g 1 cup - 337g
Vitamin C
Vit. C
Vitamin D
Vit. D
Vitamin A
Vit. A
Vitamin E
Vit. E
Vitamin B1
Vit. B1
Vitamin B2
Vit. B2
Vitamin B3
Vit. B3
Vitamin B5
Vit. B5
Vitamin B6
Vit. B6
Vitamin B12
Vit. B12
Vitamin K
Vit. K
Folate
Folate
0%
0%
0%
0%
10%
0.46%
17%
48%
155%
0%
0%
0%
All nutrients comparison - raw data values
Nutrient
DV% diff.
Saturated fat
17.953g
0.018g
82%
Manganese
0.1mg
1.53mg
62%
Vitamin B6
0.02mg
0.67mg
50%
Magnesium
37mg
242mg
49%
Iron
1mg
4.72mg
47%
Fats
25.99g
0.1g
40%
Potassium
231mg
1464mg
36%
Copper
0.22mg
0.487mg
30%
Selenium
5µg
17.8µg
23%
Vitamin B12
0.56µg
0µg
23%
Vitamin B2
0.21mg
0.002mg
16%
Fructose
0.2g
12.79g
16%
Phosphorus
135mg
31mg
15%
Monounsaturated fat
5.844g
0.032g
15%
Protein
6.51g
0g
13%
Calories
518kcal
290kcal
11%
Calcium
125mg
205mg
8%
Vitamin B1
0.117mg
0.041mg
6%
Polyunsaturated fat
0.895g
0.05g
6%
Cholesterol
11mg
0mg
4%
Fiber
1g
0g
4%
Starch
10.6g
4%
Vitamin K
5.2µg
0µg
4%
Folate
14µg
0µg
4%
Caffeine
14mg
0mg
4%
Carbs
64.59g
74.73g
3%
Vitamin A
24µg
0µg
3%
Vitamin B3
0.5mg
0.93mg
3%
Vitamin B5
0.64mg
0.804mg
3%
Choline
31mg
13.3mg
3%
Zinc
0.09mg
0.29mg
2%
Vitamin E
0.34mg
0mg
2%
Sodium
54mg
37mg
1%
Protein per 100 calories
1.3g
0g
N/A
Calories per 10 g protein
796kcal
N/A
Weight per 100 calories
19g
34g
N/A
Unsaturated / Saturated Fat ratio
0.38
4.6
N/A
Net carbs
63.59g
74.73g
N/A
Sugar
48.68g
74.72g
N/A
Trans fat
0.099g
N/A
Tryptophan
0.09mg
0%
Threonine
0.19mg
0%
Isoleucine
0.28mg
0%
Leucine
0.52mg
0%
Lysine
0.28mg
0%
Methionine
0.16mg
0%
Phenylalanine
0.27mg
0%
Valine
0.36mg
0%
Histidine
0.11mg
0%
Omega-3 - ALA
0.075g
N/A
Macronutrient Comparison
Macronutrient breakdown side-by-side comparison
2
7%
26%
65%
Protein:
6.51 g
Fats:
25.99 g
Carbs:
64.59 g
Water:
1.63 g
Other:
1.28 g
3
75%
22%
3%
Protein:
0 g
Fats:
0.1 g
Carbs:
74.73 g
Water:
21.87 g
Other:
3.3 g
Contains
more
Protein Protein
+∞%
Contains
more
Fats Fats
+25890%
Contains
more
Carbs Carbs
+15.7%
Contains
more
Water Water
+1241.7%
Contains
more
Other Other
+157.8%
Fat Type Comparison
Fat type breakdown side-by-side comparison
2
73%
24%
4%
Saturated fat:
Sat. Fat
17.953 g
Monounsaturated fat:
Mono. Fat
5.844 g
Polyunsaturated fat:
Poly. Fat
0.895 g
1
18%
32%
50%
Saturated fat:
Sat. Fat
0.018 g
Monounsaturated fat:
Mono. Fat
0.032 g
Polyunsaturated fat:
Poly. Fat
0.05 g
Contains
more
Mono. Fat Monounsaturated fat
+18162.5%
Contains
more
Poly. Fat Polyunsaturated fat
+1690%
Contains
less
Sat. Fat Saturated fat
-99.9%
Carbohydrate type comparison
Carbohydrate type breakdown side-by-side comparison
4
18%
68%
14%
Starch:
10.6 g
Sucrose:
40.04 g
Glucose:
0.16 g
Fructose:
0.2 g
Lactose:
8.21 g
Maltose:
0.07 g
Galactose:
0 g
2
54%
22%
24%
Starch:
0 g
Sucrose:
29.4 g
Glucose:
11.92 g
Fructose:
12.79 g
Lactose:
0 g
Maltose:
0 g
Galactose:
0 g
Contains
more
Starch Starch
+∞%
Contains
more
Sucrose Sucrose
+36.2%
Contains
more
Lactose Lactose
+∞%
Contains
more
Maltose Maltose
+∞%
Contains
more
Glucose Glucose
+7350%
Contains
more
Fructose Fructose
+6295%