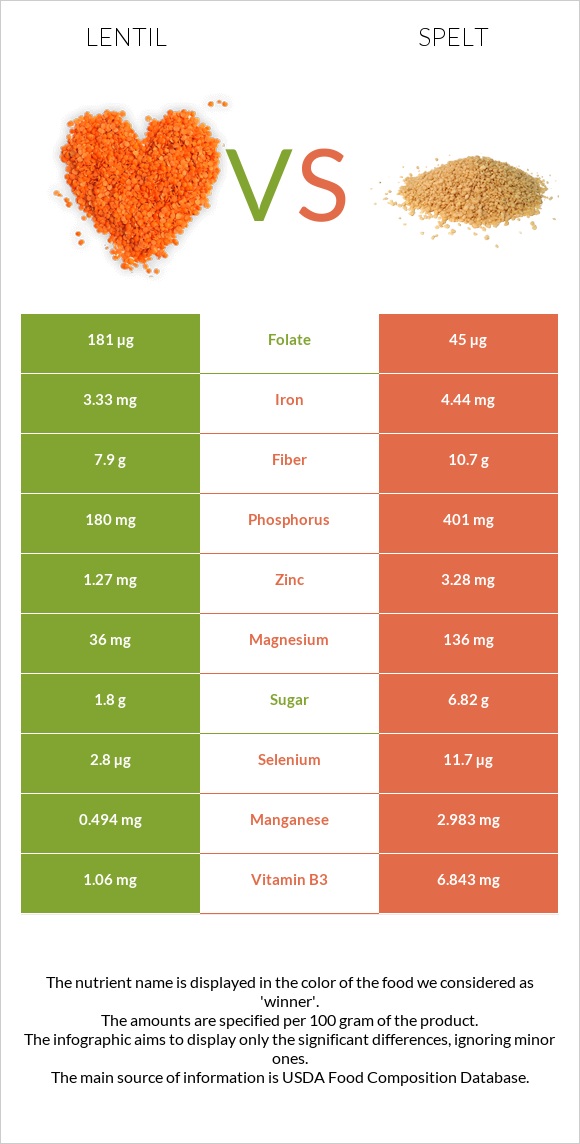
Significant differences between lentil and spelt Lentil is richer in folate, while spelt is higher in manganese, vitamin B3, phosphorus, copper, magnesium, zinc, vitamin B1, selenium, and iron. Spelt covers your daily manganese needs 108% more than lentil. Lentil has 4 times more folate than spelt. Lentil has 181µg of folate, while spelt has 45µg. Spelt has a higher glycemic index (63) than lentil (29). Specific food types used in this comparison are Lentils, mature seeds, cooked, boiled, without salt and Spelt, uncooked .
Infographic
Mineral Comparison
Mineral comparison score is based on the number of minerals by which one or the other food is richer. The "coverage" charts below show how much of the daily needs can be covered by 300 grams of the food.
1
100 g
300 g
1 tbsp - 12.3g 1 cup - 198g
Magnesium
Magnesium
Calcium
Calcium
Potassium
Potassium
Iron
Iron
Copper
Copper
Zinc
Zinc
Phosphorus
Phosphorus
Sodium
Sodium
Manganese
Manganese
Selenium
Selenium
26%
5.7%
33%
125%
84%
35%
77%
0.26%
64%
15%
8
100 g
300 g
1 cup - 174g
Magnesium
Magnesium
Calcium
Calcium
Potassium
Potassium
Iron
Iron
Copper
Copper
Zinc
Zinc
Phosphorus
Phosphorus
Sodium
Sodium
Manganese
Manganese
Selenium
Selenium
97%
8.1%
34%
167%
170%
89%
172%
1%
389%
64%
Vitamin Comparison
Vitamin comparison score is based on the number of vitamins by which one or the other food is richer. The "coverage" charts below show how much of the daily needs can be covered by 300 grams of the food.
2
100 g
300 g
1 tbsp - 12.3g 1 cup - 198g
Vitamin C
Vit. C
Vitamin D
Vit. D
Vitamin A
Vit. A
Vitamin E
Vit. E
Vitamin B1
Vit. B1
Vitamin B2
Vit. B2
Vitamin B3
Vit. B3
Vitamin B5
Vit. B5
Vitamin B6
Vit. B6
Vitamin B12
Vit. B12
Vitamin K
Vit. K
Folate
Folate
5%
0%
0%
2.2%
42%
17%
20%
38%
41%
0%
4.3%
136%
7
100 g
300 g
1 cup - 174g
Vitamin C
Vit. C
Vitamin D
Vit. D
Vitamin A
Vit. A
Vitamin E
Vit. E
Vitamin B1
Vit. B1
Vitamin B2
Vit. B2
Vitamin B3
Vit. B3
Vitamin B5
Vit. B5
Vitamin B6
Vit. B6
Vitamin B12
Vit. B12
Vitamin K
Vit. K
Folate
Folate
0%
0%
0%
16%
91%
26%
128%
64%
53%
0%
9%
34%
All nutrients comparison - raw data values
Nutrient
DV% diff.
Manganese
0.494mg
2.983mg
108%
Vitamin B3
1.06mg
6.843mg
36%
Folate
181µg
45µg
34%
Phosphorus
180mg
401mg
32%
Copper
0.251mg
0.511mg
29%
Magnesium
36mg
136mg
24%
Starch
53.92g
22%
Zinc
1.27mg
3.28mg
18%
Carbs
20.13g
70.19g
17%
Selenium
2.8µg
11.7µg
16%
Vitamin B1
0.169mg
0.364mg
16%
Iron
3.33mg
4.44mg
14%
Calories
116kcal
338kcal
11%
Protein
9.02g
14.57g
11%
Fiber
7.9g
10.7g
11%
Vitamin B5
0.638mg
1.068mg
9%
Polyunsaturated fat
0.175g
1.258g
7%
Choline
32.7mg
6%
Vitamin E
0.11mg
0.79mg
5%
Vitamin B6
0.178mg
0.23mg
4%
Fats
0.38g
2.43g
3%
Vitamin B2
0.073mg
0.113mg
3%
Vitamin C
1.5mg
0mg
2%
Vitamin K
1.7µg
3.6µg
2%
Saturated fat
0.053g
0.406g
2%
Calcium
19mg
27mg
1%
Potassium
369mg
388mg
1%
Monounsaturated fat
0.064g
0.445g
1%
Protein per 100 calories
7.8g
4.3g
N/A
Calories per 10 g protein
129kcal
232kcal
N/A
Weight per 100 calories
86g
30g
N/A
Unsaturated / Saturated Fat ratio
4.5
4.2
N/A
Net carbs
12.23g
59.49g
N/A
Sugar
1.8g
6.82g
N/A
Sodium
2mg
8mg
0%
Tryptophan
0.081mg
0.132mg
0%
Threonine
0.323mg
0.443mg
0%
Isoleucine
0.39mg
0.552mg
0%
Leucine
0.654mg
1.07mg
0%
Lysine
0.63mg
0.409mg
0%
Methionine
0.077mg
0.258mg
0%
Phenylalanine
0.445mg
0.737mg
0%
Valine
0.448mg
0.681mg
0%
Histidine
0.254mg
0.36mg
0%
Fructose
0.24g
0%
Omega-3 - ALA
0.065g
N/A
Macronutrient Comparison
Macronutrient breakdown side-by-side comparison
1
9%
20%
70%
Protein:
9.02 g
Fats:
0.38 g
Carbs:
20.13 g
Water:
69.64 g
Other:
0.83 g
4
15%
2%
70%
11%
2%
Protein:
14.57 g
Fats:
2.43 g
Carbs:
70.19 g
Water:
11.02 g
Other:
1.79 g
Contains
more
Water Water
+531.9%
Contains
more
Protein Protein
+61.5%
Contains
more
Fats Fats
+539.5%
Contains
more
Carbs Carbs
+248.7%
Contains
more
Other Other
+115.7%
Fat Type Comparison
Fat type breakdown side-by-side comparison
1
18%
22%
60%
Saturated fat:
Sat. Fat
0.053 g
Monounsaturated fat:
Mono. Fat
0.064 g
Polyunsaturated fat:
Poly. Fat
0.175 g
2
19%
21%
60%
Saturated fat:
Sat. Fat
0.406 g
Monounsaturated fat:
Mono. Fat
0.445 g
Polyunsaturated fat:
Poly. Fat
1.258 g
Contains
less
Sat. Fat Saturated fat
-86.9%
Contains
more
Mono. Fat Monounsaturated fat
+595.3%
Contains
more
Poly. Fat Polyunsaturated fat
+618.9%