LITTLE CAESARS 14" Pepperoni Pizza, Large Deep Dish Crust vs. Club sandwich — In-Depth Nutrition Comparison
Compare
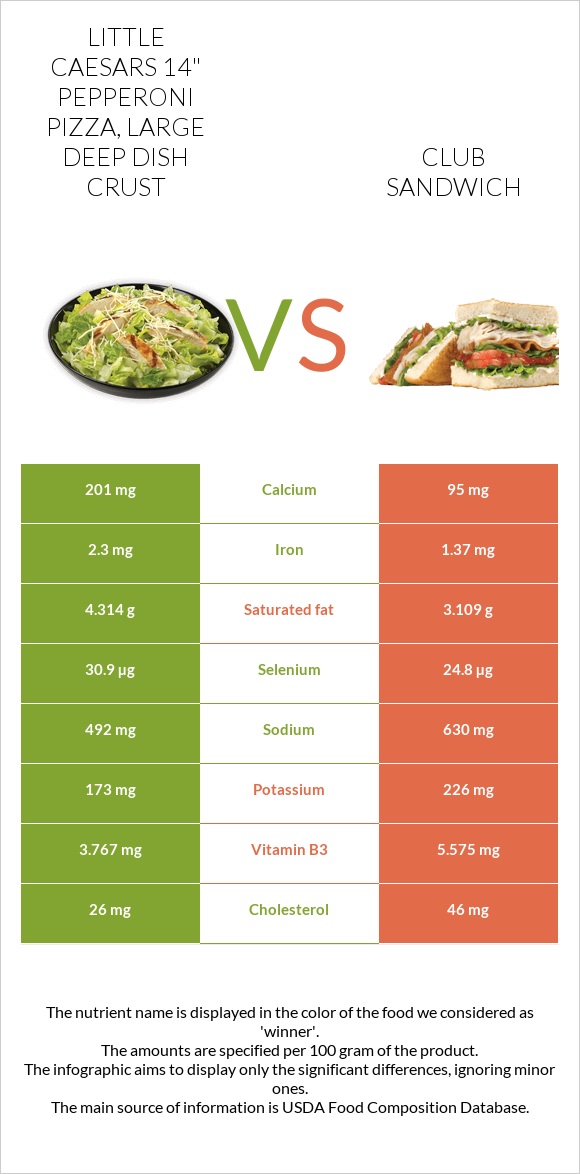
Important differences between lITTLE CAESARS 14" Pepperoni Pizza, Large Deep Dish Crust and club sandwich
- LITTLE CAESARS 14" Pepperoni Pizza, Large Deep Dish Crust has more vitamin B1, iron, selenium, calcium, and vitamin B2; however, club sandwich is richer in vitamin B3 and vitamin B5.
- LITTLE CAESARS 14" Pepperoni Pizza, Large Deep Dish Crust's daily need coverage for vitamin B1 is 17% more.
- LITTLE CAESARS 14" Pepperoni Pizza, Large Deep Dish Crust contains 2 times more calcium than club sandwich. LITTLE CAESARS 14" Pepperoni Pizza, Large Deep Dish Crust contains 201mg of calcium, while club sandwich contains 95mg.
- Club sandwich contains less saturated fat.
The food varieties used in the comparison are LITTLE CAESARS 14" Pepperoni Pizza, Large Deep Dish Crust and Fast foods, grilled chicken, bacon, and tomato club sandwich, with cheese, lettuce, and mayonnaise.
Infographic
Infographic link
Mineral Comparison
Mineral comparison score is based on the number of minerals by which one or the other food is richer. The "coverage" charts below show how much of the daily needs can be covered by 300 grams of the food.
| Contains more CalciumCalcium | +111.6% |
| Contains more IronIron | +67.9% |
| Contains more CopperCopper | +36% |
| Contains more ZincZinc | +17.2% |
| Contains less SodiumSodium | -21.9% |
| Contains more ManganeseManganese | +∞% |
| Contains more SeleniumSelenium | +24.6% |
| Contains more MagnesiumMagnesium | +18.5% |
| Contains more PotassiumPotassium | +30.6% |
Vitamin Comparison
Vitamin comparison score is based on the number of vitamins by which one or the other food is richer. The "coverage" charts below show how much of the daily needs can be covered by 300 grams of the food.
| Contains more Vitamin AVitamin A | +85.7% |
| Contains more Vitamin EVitamin E | +32.8% |
| Contains more Vitamin B1Vitamin B1 | +116.9% |
| Contains more Vitamin B2Vitamin B2 | +50.5% |
| Contains more Vitamin CVitamin C | +∞% |
| Contains more Vitamin B3Vitamin B3 | +48% |
| Contains more Vitamin B5Vitamin B5 | +71% |
| Contains more Vitamin KVitamin K | +22.5% |
All nutrients comparison - raw data values
| Nutrient |  |
 |
DV% diff. |
| Vitamin B6 | 0.296mg | 23% | |
| Vitamin B1 | 0.373mg | 0.172mg | 17% |
| Manganese | 0.316mg | 14% | |
| Iron | 2.3mg | 1.37mg | 12% |
| Calcium | 201mg | 95mg | 11% |
| Selenium | 30.9µg | 24.8µg | 11% |
| Vitamin B3 | 3.767mg | 5.575mg | 11% |
| Protein | 12.93g | 17.19g | 9% |
| Starch | 22.3g | 9% | |
| Choline | 47.8mg | 9% | |
| Folate | 31µg | 8% | |
| Cholesterol | 26mg | 46mg | 7% |
| Vitamin B2 | 0.28mg | 0.186mg | 7% |
| Vitamin B5 | 0.483mg | 0.826mg | 7% |
| Sodium | 492mg | 630mg | 6% |
| Vitamin C | 0mg | 4.4mg | 5% |
| Saturated fat | 4.314g | 3.109g | 5% |
| Fats | 10.81g | 8.05g | 4% |
| Copper | 0.121mg | 0.089mg | 4% |
| Carbs | 29.03g | 19.87g | 3% |
| Vitamin A | 65µg | 35µg | 3% |
| Calories | 265kcal | 220kcal | 2% |
| Potassium | 173mg | 226mg | 2% |
| Zinc | 1.57mg | 1.34mg | 2% |
| Vitamin D* | 5 IU | 1% | |
| Vitamin D | 0.1µg | 1% | |
| Magnesium | 27mg | 32mg | 1% |
| Fiber | 1.5g | 1.2g | 1% |
| Vitamin E | 0.81mg | 0.61mg | 1% |
| Vitamin K | 7.1µg | 8.7µg | 1% |
| Monounsaturated fat | 3.151g | 2.949g | 1% |
| Polyunsaturated fat | 1.756g | 1.88g | 1% |
| Fructose | 0.97g | 1% | |
| Protein per 100 calories | 4.9g | 7.8g | N/A |
| Calories per 10 g protein | 205kcal | 128kcal | N/A |
| Weight per 100 calories | 38g | 45g | N/A |
| Unsaturated / Saturated Fat ratio | 1.1 | 1.6 | N/A |
| Net carbs | 27.53g | 18.67g | N/A |
| Sugar | 3.39g | 4.68g | N/A |
| Phosphorus | 215mg | 215mg | 0% |
| Vitamin B12 | 0.46µg | 0.47µg | 0% |
| Trans fat | 0.071g | N/A | |
| Tryptophan | 0.11mg | 0% | |
| Threonine | 0.369mg | 0% | |
| Isoleucine | 0.515mg | 0% | |
| Leucine | 1.066mg | 0% | |
| Lysine | 0.795mg | 0% | |
| Methionine | 0.275mg | 0% | |
| Phenylalanine | 0.661mg | 0% | |
| Valine | 0.64mg | 0% | |
| Histidine | 0.342mg | 0% | |
| Omega-3 - EPA | 0.004g | N/A | |
| Omega-3 - DHA | 0.007g | N/A | |
| Omega-3 - ALA | 0.177g | N/A | |
| Omega-3 - DPA | 0.004g | N/A | |
| Omega-6 - Eicosadienoic acid | 0.008g | N/A |
Macronutrient Comparison
Macronutrient breakdown side-by-side comparison
Protein:
12.93 g
Fats:
10.81 g
Carbs:
29.03 g
Water:
44.98 g
Other:
2.25 g
Protein:
17.19 g
Fats:
8.05 g
Carbs:
19.87 g
Water:
52.52 g
Other:
2.37 g
| Contains more FatsFats | +34.3% |
| Contains more CarbsCarbs | +46.1% |
| Contains more ProteinProtein | +32.9% |
| Contains more WaterWater | +16.8% |
~equal in
Other
~2.37g
Fat Type Comparison
Fat type breakdown side-by-side comparison
Saturated fat:
Sat. Fat
4.314 g
Monounsaturated fat:
Mono. Fat
3.151 g
Polyunsaturated fat:
Poly. Fat
1.756 g
Saturated fat:
Sat. Fat
3.109 g
Monounsaturated fat:
Mono. Fat
2.949 g
Polyunsaturated fat:
Poly. Fat
1.88 g
| Contains less Sat. FatSaturated fat | -27.9% |
~equal in
Monounsaturated fat
~2.949g
~equal in
Polyunsaturated fat
~1.88g