LITTLE CAESARS 14" Pepperoni Pizza, Large Deep Dish Crust vs. Pizza — In-Depth Nutrition Comparison
Compare
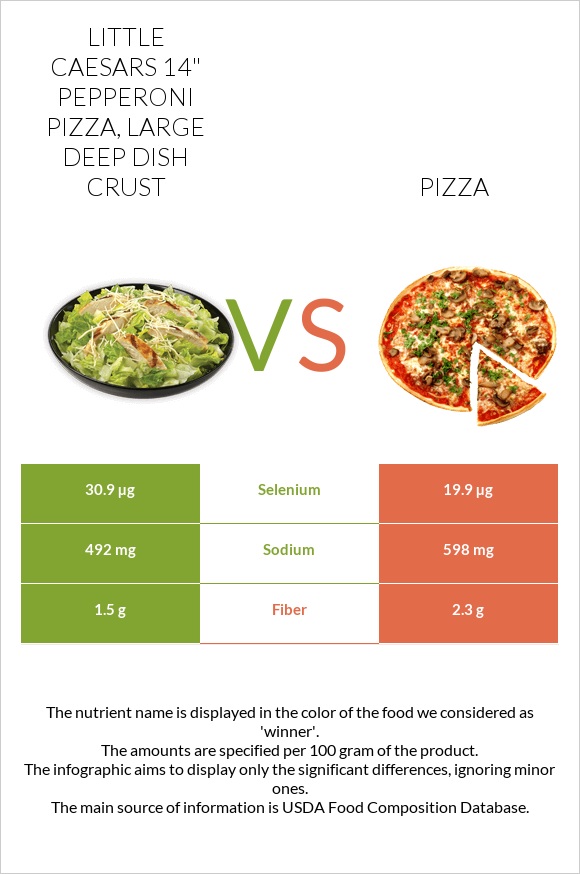
Significant differences between lITTLE CAESARS 14" Pepperoni Pizza, Large Deep Dish Crust and pizza
- The amount of selenium and vitamin B2 in lITTLE CAESARS 14" Pepperoni Pizza, Large Deep Dish Crust is higher than in pizza.
- LITTLE CAESARS 14" Pepperoni Pizza, Large Deep Dish Crust covers your daily selenium needs 20% more than pizza.
- LITTLE CAESARS 14" Pepperoni Pizza, Large Deep Dish Crust contains less sodium.
Specific food types used in this comparison are LITTLE CAESARS 14" Pepperoni Pizza, Large Deep Dish Crust and Fast Food, Pizza Chain, 14" pizza, cheese topping, regular crust.
Infographic
Infographic link
Mineral Comparison
Mineral comparison score is based on the number of minerals by which one or the other food is richer. The "coverage" charts below show how much of the daily needs can be covered by 300 grams of the food.
| Contains more MagnesiumMagnesium | +12.5% |
| Contains more CopperCopper | +15.2% |
| Contains more ZincZinc | +17.2% |
| Contains less SodiumSodium | -17.7% |
| Contains more SeleniumSelenium | +55.3% |
| Contains more ManganeseManganese | +13.9% |
Vitamin Comparison
Vitamin comparison score is based on the number of vitamins by which one or the other food is richer. The "coverage" charts below show how much of the daily needs can be covered by 300 grams of the food.
| Contains more Vitamin B2Vitamin B2 | +43.6% |
| Contains more Vitamin B5Vitamin B5 | +∞% |
| Contains more Vitamin CVitamin C | +∞% |
All nutrients comparison - raw data values
| Nutrient |  |
 |
DV% diff. |
| Folate | 93µg | 23% | |
| Selenium | 30.9µg | 19.9µg | 20% |
| Vitamin B5 | 0.483mg | 10% | |
| Vitamin B2 | 0.28mg | 0.195mg | 7% |
| Vitamin B6 | 0.08mg | 6% | |
| Sodium | 492mg | 598mg | 5% |
| Protein | 12.93g | 11.39g | 3% |
| Cholesterol | 26mg | 17mg | 3% |
| Fiber | 1.5g | 2.3g | 3% |
| Choline | 16.4mg | 3% | |
| Fats | 10.81g | 9.69g | 2% |
| Vitamin C | 0mg | 1.4mg | 2% |
| Iron | 2.3mg | 2.48mg | 2% |
| Copper | 0.121mg | 0.105mg | 2% |
| Zinc | 1.57mg | 1.34mg | 2% |
| Starch | 22.3g | 26.95g | 2% |
| Manganese | 0.316mg | 0.36mg | 2% |
| Vitamin B12 | 0.46µg | 0.42µg | 2% |
| Carbs | 29.03g | 33.33g | 1% |
| Magnesium | 27mg | 24mg | 1% |
| Calcium | 201mg | 188mg | 1% |
| Vitamin B1 | 0.373mg | 0.39mg | 1% |
| Saturated fat | 4.314g | 4.465g | 1% |
| Monounsaturated fat | 3.151g | 2.608g | 1% |
| Calories | 265kcal | 266kcal | 0% |
| Protein per 100 calories | 4.9g | 4.3g | N/A |
| Calories per 10 g protein | 205kcal | 234kcal | N/A |
| Weight per 100 calories | 38g | 38g | N/A |
| Unsaturated / Saturated Fat ratio | 1.1 | 0.96 | N/A |
| Net carbs | 27.53g | 31.03g | N/A |
| Potassium | 173mg | 172mg | 0% |
| Sugar | 3.39g | 3.58g | N/A |
| Phosphorus | 215mg | 216mg | 0% |
| Vitamin A | 65µg | 69µg | 0% |
| Vitamin E | 0.81mg | 0.83mg | 0% |
| Vitamin B3 | 3.767mg | 3.825mg | 0% |
| Vitamin K | 7.1µg | 6.7µg | 0% |
| Trans fat | 0.241g | N/A | |
| Polyunsaturated fat | 1.756g | 1.681g | 0% |
| Tryptophan | 0.11mg | 0% | |
| Threonine | 0.369mg | 0.41mg | 0% |
| Isoleucine | 0.515mg | 0.564mg | 0% |
| Leucine | 1.066mg | 1.139mg | 0% |
| Lysine | 0.795mg | 0.77mg | 0% |
| Methionine | 0.275mg | 0.264mg | 0% |
| Phenylalanine | 0.661mg | 0.664mg | 0% |
| Valine | 0.64mg | 0.72mg | 0% |
| Histidine | 0.342mg | 0.355mg | 0% |
| Fructose | 0.97g | 1g | 0% |
| Omega-3 - EPA | 0.004g | N/A | |
| Omega-3 - ALA | 0.177g | 0.175g | N/A |
| Omega-3 - DPA | 0.004g | N/A | |
| Omega-6 - Gamma-linoleic acid | 0g | 0.003g | N/A |
| Omega-6 - Dihomo-gamma-linoleic acid | 0.009g | N/A | |
| Omega-6 - Eicosadienoic acid | 0.008g | 0.003g | N/A |
| Omega-6 - Linoleic acid | 1.367g | N/A |
Macronutrient Comparison
Macronutrient breakdown side-by-side comparison
Protein:
12.93 g
Fats:
10.81 g
Carbs:
29.03 g
Water:
44.98 g
Other:
2.25 g
Protein:
11.39 g
Fats:
9.69 g
Carbs:
33.33 g
Water:
43.17 g
Other:
2.42 g
| Contains more ProteinProtein | +13.5% |
| Contains more FatsFats | +11.6% |
| Contains more CarbsCarbs | +14.8% |
~equal in
Water
~43.17g
~equal in
Other
~2.42g
Fat Type Comparison
Fat type breakdown side-by-side comparison
Saturated fat:
Sat. Fat
4.314 g
Monounsaturated fat:
Mono. Fat
3.151 g
Polyunsaturated fat:
Poly. Fat
1.756 g
Saturated fat:
Sat. Fat
4.465 g
Monounsaturated fat:
Mono. Fat
2.608 g
Polyunsaturated fat:
Poly. Fat
1.681 g
| Contains more Mono. FatMonounsaturated fat | +20.8% |
~equal in
Saturated fat
~4.465g
~equal in
Polyunsaturated fat
~1.681g
Carbohydrate type comparison
Carbohydrate type breakdown side-by-side comparison
Starch:
22.3 g
Sucrose:
0 g
Glucose:
0.86 g
Fructose:
0.97 g
Lactose:
0.07 g
Maltose:
1.35 g
Galactose:
0.13 g
Starch:
26.95 g
Sucrose:
0.2 g
Glucose:
0.78 g
Fructose:
1 g
Lactose:
0.42 g
Maltose:
1.05 g
Galactose:
0.13 g
| Contains more MaltoseMaltose | +28.6% |
| Contains more StarchStarch | +20.9% |
| Contains more SucroseSucrose | +∞% |
| Contains more LactoseLactose | +500% |
~equal in
Glucose
~0.78g
~equal in
Fructose
~1g
~equal in
Galactose
~0.13g