Mandarin orange vs. Mango — In-Depth Nutrition Comparison
Compare
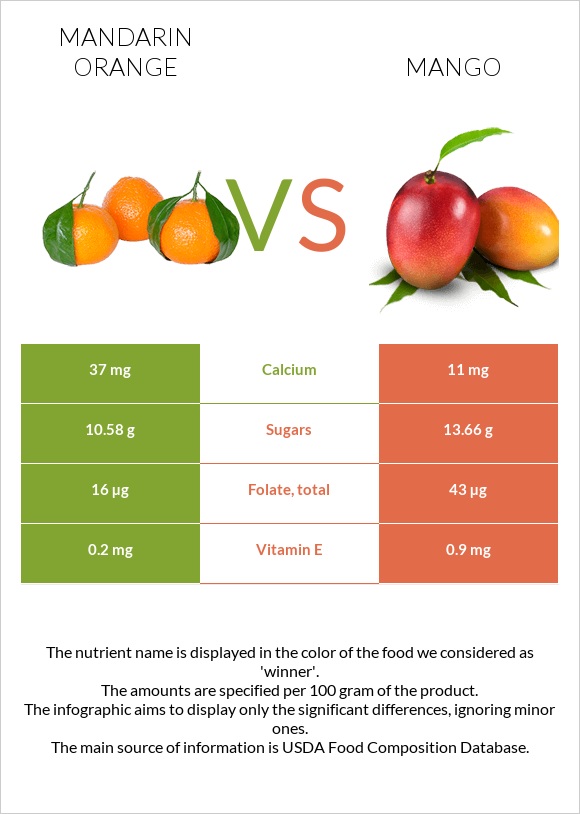
The main differences between mandarin oranges and mango
- Mango is richer than mandarin oranges in vitamin C, vitamin A, copper, and folate.
- Daily need coverage for vitamin C for mango is 11% higher.
- Mandarin oranges contain 3 times more calcium than mango. Mandarin oranges contain 37mg of calcium, while mango contains 11mg.
- Mandarin oranges contain less sugar.
Food types used in this article are Tangerines, (mandarin oranges), raw and Mangos, raw.
Infographic
Infographic link
Mineral Comparison
Mineral comparison score is based on the number of minerals by which one or the other food is richer. The "coverage" charts below show how much of the daily needs can be covered by 300 grams of the food.
| Contains more MagnesiumMagnesium | +20% |
| Contains more CalciumCalcium | +236.4% |
| Contains more PhosphorusPhosphorus | +42.9% |
| Contains more CopperCopper | +164.3% |
| Contains more ZincZinc | +28.6% |
| Contains less SodiumSodium | -50% |
| Contains more ManganeseManganese | +61.5% |
| Contains more SeleniumSelenium | +500% |
Vitamin Comparison
Vitamin comparison score is based on the number of vitamins by which one or the other food is richer. The "coverage" charts below show how much of the daily needs can be covered by 300 grams of the food.
| Contains more Vitamin B1Vitamin B1 | +107.1% |
| Contains more Vitamin CVitamin C | +36.3% |
| Contains more Vitamin AVitamin A | +58.8% |
| Contains more Vitamin EVitamin E | +350% |
| Contains more Vitamin B3Vitamin B3 | +77.9% |
| Contains more Vitamin B6Vitamin B6 | +52.6% |
| Contains more Vitamin KVitamin K | +∞% |
| Contains more FolateFolate | +168.8% |
All nutrients comparison - raw data values
| Nutrient |  |
 |
DV% diff. |
| Vitamin C | 26.7mg | 36.4mg | 11% |
| Copper | 0.042mg | 0.111mg | 8% |
| Folate | 16µg | 43µg | 7% |
| Vitamin E | 0.2mg | 0.9mg | 5% |
| Vitamin K | 0µg | 4.2µg | 4% |
| Calcium | 37mg | 11mg | 3% |
| Vitamin B1 | 0.058mg | 0.028mg | 3% |
| Vitamin B6 | 0.078mg | 0.119mg | 3% |
| Fructose | 2.4g | 4.68g | 3% |
| Vitamin A | 34µg | 54µg | 2% |
| Vitamin B3 | 0.376mg | 0.669mg | 2% |
| Carbs | 13.34g | 14.98g | 1% |
| Fiber | 1.8g | 1.6g | 1% |
| Phosphorus | 20mg | 14mg | 1% |
| Manganese | 0.039mg | 0.063mg | 1% |
| Selenium | 0.1µg | 0.6µg | 1% |
| Calories | 53kcal | 60kcal | 0% |
| Protein | 0.81g | 0.82g | 0% |
| Protein per 100 calories | 1.5g | 1.4g | N/A |
| Calories per 10 g protein | 654kcal | 732kcal | N/A |
| Weight per 100 calories | 189g | 167g | N/A |
| Fats | 0.31g | 0.38g | 0% |
| Net carbs | 11.54g | 13.38g | N/A |
| Magnesium | 12mg | 10mg | 0% |
| Potassium | 166mg | 168mg | 0% |
| Iron | 0.15mg | 0.16mg | 0% |
| Sugar | 10.58g | 13.66g | N/A |
| Zinc | 0.07mg | 0.09mg | 0% |
| Sodium | 2mg | 1mg | 0% |
| Vitamin B2 | 0.036mg | 0.038mg | 0% |
| Vitamin B5 | 0.216mg | 0.197mg | 0% |
| Choline | 10.2mg | 7.6mg | 0% |
| Saturated fat | 0.039g | 0.092g | 0% |
| Monounsaturated fat | 0.06g | 0.14g | 0% |
| Polyunsaturated fat | 0.065g | 0.071g | 0% |
| Tryptophan | 0.002mg | 0.013mg | 0% |
| Threonine | 0.016mg | 0.031mg | 0% |
| Isoleucine | 0.017mg | 0.029mg | 0% |
| Leucine | 0.028mg | 0.05mg | 0% |
| Lysine | 0.032mg | 0.066mg | 0% |
| Methionine | 0.002mg | 0.008mg | 0% |
| Phenylalanine | 0.018mg | 0.027mg | 0% |
| Valine | 0.021mg | 0.042mg | 0% |
| Histidine | 0.011mg | 0.019mg | 0% |
Macronutrient Comparison
Macronutrient breakdown side-by-side comparison
Protein:
0.81 g
Fats:
0.31 g
Carbs:
13.34 g
Water:
85.17 g
Other:
0.37 g
Protein:
0.82 g
Fats:
0.38 g
Carbs:
14.98 g
Water:
83.46 g
Other:
0.36 g
| Contains more FatsFats | +22.6% |
| Contains more CarbsCarbs | +12.3% |
~equal in
Protein
~0.82g
~equal in
Water
~83.46g
~equal in
Other
~0.36g
Fat Type Comparison
Fat type breakdown side-by-side comparison
Saturated fat:
Sat. Fat
0.039 g
Monounsaturated fat:
Mono. Fat
0.06 g
Polyunsaturated fat:
Poly. Fat
0.065 g
Saturated fat:
Sat. Fat
0.092 g
Monounsaturated fat:
Mono. Fat
0.14 g
Polyunsaturated fat:
Poly. Fat
0.071 g
| Contains less Sat. FatSaturated fat | -57.6% |
| Contains more Mono. FatMonounsaturated fat | +133.3% |
~equal in
Polyunsaturated fat
~0.071g
Carbohydrate type comparison
Carbohydrate type breakdown side-by-side comparison
Starch:
0 g
Sucrose:
6.05 g
Glucose:
2.13 g
Fructose:
2.4 g
Lactose:
0 g
Maltose:
0 g
Galactose:
0 g
Starch:
0 g
Sucrose:
6.97 g
Glucose:
2.01 g
Fructose:
4.68 g
Lactose:
0 g
Maltose:
0 g
Galactose:
0 g
| Contains more SucroseSucrose | +15.2% |
| Contains more FructoseFructose | +95% |
~equal in
Starch
~0g
~equal in
Glucose
~2.01g
~equal in
Lactose
~0g
~equal in
Maltose
~0g
~equal in
Galactose
~0g


