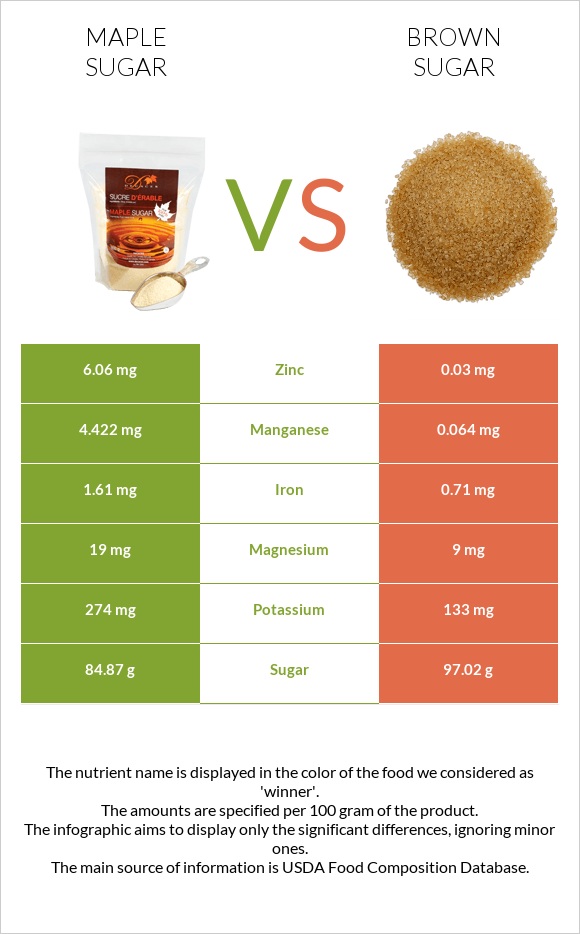
Maple sugar vs. Brown sugar — Health Impact and Nutrition Comparison


Summary
Both brown and maple sugars are primarily carbs; however, maple sugar is comparably lower in carbs.
Maple sugar is richer in iron, zinc, potassium, magnesium, manganese, and copper and lower in sodium, while brown sugar is richer in phosphorus and selenium.
Adequate intake of brown and maple sugars may benefit health, whereas long-term overconsumption may lead to caries, diabetes, and other health problems.
Introduction
Brown sugar is a sugar product that contains molasses. It can be natural and commercial. Natural brown sugar or raw sugar is unrefined or partially refined sugar with some molasses content, whereas commercial brown sugar is made by adding molasses to refined white sugar.
Maple sugar is a sweetener made from the sap of the maple tree. Maple sugar and syrup are made from boiling maple sap; however, to make maple sugar, the boiling process lasts until all the water is boiled away and only solid sugar is left.
Nutrition
The nutritional values in this article are presented for maple sugar and brown sugar.
Macronutrients and Calories
The maple and brown sugars are primarily carbohydrates, with insignificant proteins and fats. The carb content in maple and brown sugars is 91% and 98%, respectively.
The average serving size of sugars is one teaspoon, which is ~3g.
Calories
A 100g of maple sugar provides 354 calories, whereas a 100g of brown sugar provides 380 calories; hence, one teaspoon of maple sugar provides 10.6 calories, whereas brown sugar (brownulated) provides 12.2 calories.
Protein & Fats
Brown and maple sugars contain less than 1g of protein and fats.
Carbohydrates
Brown and maple sugars are primarily carbs.
Maple sugar contains 90.9g of carbs, while brown sugar contains 98.09g of carbs. Sucrose (sugar) accounts for over 90% of carbs.
Vitamins & Minerals
Maple and brown sugars are either absent or very low in vitamins.
When comparing the mineral contents, maple sugar is the winner in this category. Maple sugar is richer in iron, zinc, potassium, magnesium, manganese, and copper and lower in sodium, while brown sugar is richer in phosphorus and selenium.
Mineral Comparison
Contains
more
MagnesiumMagnesium
+111.1%
Contains
more
PotassiumPotassium
+106%
Contains
more
IronIron
+126.8%
Contains
more
CopperCopper
+110.6%
Contains
more
ZincZinc
+20100%
Contains
less
SodiumSodium
-60.7%
Contains
more
ManganeseManganese
+6809.4%
Contains
more
PhosphorusPhosphorus
+33.3%
Contains
more
SeleniumSelenium
+50%
Glycemic Index & Insulin Index
Brown sugar has a glycemic index value of 71±5 and an insulin index of 83.
Detailed information about brown sugar’s glycemic index is provided on our “Brown Sugar” page.
There is no calculated glycemic or insulin index value of maple sugar; however, maple syrup is calculated to have a glycemic index value of 54±6 (1).
Acidity
Sugars have a neutral pH value; however, after appearing in the organism and being digested, they decrease the pH of the host's saliva.
Health Impact
Both maple and brown sugars contain varying levels of phytochemicals with antioxidant, antimicrobial, and anti-inflammatory properties (2, 3, 4).
Potential Health Benefits of Brown Sugar
- Menstrual cramps: Brown sugar tea is used in several East Asian countries to relieve menstrual pain. Adding ginger to the tea may more effectively relieve the pain (5, 6).
- Weight loss: Brown sugar is rumored to boost metabolism and satiety, but no studies support this claim.
- Constipation: Brown sugar sometimes is used to relieve constipation. By elevating the sympathetic nervous system’s activity, brown sugar (added to water) may help during functional constipation in babies and children; however, it’s unclear whether it works for adults, too (7, 8).
- Asthma: Brown sugar is known in traditional medicine to help alleviate asthma symptoms; this is not science-backed.
Potential Health Benefits of Maple Sugar
- Cancer: Maple syrup is studied to have anti-cancer properties. One study suggests maple syrup may inhibit cancer cell proliferation and be used as a phytomedicine for gastrointestinal cancer treatment (9).
- Liver Disease: Several animal studies demonstrate a potential protective role of maple syrup antioxidants on liver cells during liver injury (10, 11, 12).
- Prebiotic effect: Inulin is a prebiotic found in maple sugar. Prebiotics are food ingredients that beneficially affect the host’s microbiota by selectively stimulating the growth of probiotic bacteria (13, 14).
- Interaction with antibiotics: One study has found strong synergistic interaction between maple syrup extract and two antibiotics, ciprofloxacin and carbenicillin. The maple syrup extract has also repressed antibiotic resistance genes, biofilm formation, and bacterial virulence (15).
Moderation is key. Overconsumption of free sugars (recommended = less than 7%, maximum = 10% of total calorie intake) will likely cause adverse health effects (16, 17).
Any sugars added to foods and drinks, such as sweetened beverages, ice cream, milkshakes, flavored yogurts, desserts, cookies, and sweet snacks, are added sugars.
Potential Downsides And Risks of Added Sugars
- Dental caries: Sugar intake is a significant risk factor for dental caries (tooth decay) and enamel erosion. The main influencing factors for dental caries are the bacterial digestion of sugar, the presence of acidogenic bacteria in teeth plaque, and the ability of fluoride and saliva to counteract bacteria and acids (18, 19).
- Depression: Long-term overconsumption of added sugars leads to disturbed metabolic, inflammatory, and neurobiological processes, which play a role in the development of depression. Lower intake of added sugars may be beneficial for psychological health (20, 21, 22, 23, 24).
- Metabolic syndrome: Overconsumption of sugar is associated with the development of the metabolic syndrome. Metabolic syndrome is characterized by a group of conditions: obesity (abdominal or general), high triglycerides and low HDL (“good”) cholesterol, high blood pressure, and insulin resistance. The mentioned conditions are risk factors for fatty liver, heart disease, and type 2 diabetes (25, 26, 27, 28).
- Acne: Milk, sugary foods, and drinks are known to cause acne. In high-sugar diets, serum insulin and IGF-1 are elevated, leading to increased androgen production and subsequent acne development (29, 30, 31).
Sources.
- https://academic.oup.com/ajcn/article/114/5/1625/6320814
- https://pubmed.ncbi.nlm.nih.gov/34180070/
- https://pubmed.ncbi.nlm.nih.gov/19103324
- https://pubmed.ncbi.nlm.nih.gov/17938552/
- https://bmjopen.bmj.com/content/9/9/e026813
- https://pubmed.ncbi.nlm.nih.gov/23729340/
- https://pubmed.ncbi.nlm.nih.gov/35963416/
- https://www.ncbi.nlm.nih.gov/pmc/articles/PMC1638847/pdf/brmedj00505-0043.pdf
- https://www.spandidos-publications.com/10.3892/br.2017.910
- https://academic.oup.com/bbb/article/75/12/2408/5949935
- https://pubmed.ncbi.nlm.nih.gov/31945627/
- https://pubmed.ncbi.nlm.nih.gov/29091708/
- https://www.researchgate.net/publication/281093744
- https://pubmed.ncbi.nlm.nih.gov/27612524/
- https://www.ncbi.nlm.nih.gov/pmc/articles/PMC4421064/
- Sugar: the facts - NHS
- Dietary Guidelines for Americans, 2020-2025
- https://pubmed.ncbi.nlm.nih.gov/31940627/
- https://www.ncbi.nlm.nih.gov/pmc/articles/PMC4802044/
- https://pubmed.ncbi.nlm.nih.gov/30951762/
- https://www.ncbi.nlm.nih.gov/pmc/articles/PMC9323357/
- https://pubmed.ncbi.nlm.nih.gov/31634771/
- https://pubmed.ncbi.nlm.nih.gov/30419536/
- https://pubmed.ncbi.nlm.nih.gov/28751637/
- https://e-jla.org/pdf/10.12997/jla.2022.11.1.20
- https://www.ncbi.nlm.nih.gov/pmc/articles/PMC4822166/
- https://www.ncbi.nlm.nih.gov/pmc/articles/PMC6769797/
- https://academic.oup.com/toxsci/article/162/1/36/4585010
- https://pubmed.ncbi.nlm.nih.gov/21034984/
- https://pubmed.ncbi.nlm.nih.gov/32520303/
- https://pubmed.ncbi.nlm.nih.gov/34806756/

Infographic
Vitamin Comparison
| Contains more Vitamin B1Vitamin B1 | +∞% |
| Contains more Vitamin B2Vitamin B2 | +∞% |
| Contains more Vitamin B3Vitamin B3 | +175% |
| Contains more Vitamin B5Vitamin B5 | +175% |
| Contains more Vitamin B6Vitamin B6 | +1266.7% |
| Contains more FolateFolate | +∞% |
All nutrients comparison - raw data values
| Nutrient | |
|
DV% diff. |
| Manganese | 4.422mg | 0.064mg | 189% |
| Zinc | 6.06mg | 0.03mg | 55% |
| Iron | 1.61mg | 0.71mg | 11% |
| Copper | 0.099mg | 0.047mg | 6% |
| Potassium | 274mg | 133mg | 4% |
| Vitamin B6 | 0.003mg | 0.041mg | 3% |
| Carbs | 90.9g | 98.09g | 2% |
| Magnesium | 19mg | 9mg | 2% |
| Vitamin B5 | 0.048mg | 0.132mg | 2% |
| Calories | 354kcal | 380kcal | 1% |
| Calcium | 90mg | 83mg | 1% |
| Sodium | 11mg | 28mg | 1% |
| Selenium | 0.8µg | 1.2µg | 1% |
| Vitamin B1 | 0.009mg | 0mg | 1% |
| Vitamin B2 | 0.013mg | 0mg | 1% |
| Polyunsaturated fat | 0.1g | 0g | 1% |
| Fructose | 1.11g | 1% | |
| Protein | 0.1g | 0.12g | 0% |
| Weight per 100 calories | 28g | 26g | N/A |
| Fats | 0.2g | 0g | 0% |
| Net carbs | 90.9g | 98.09g | N/A |
| Sugar | 84.87g | 97.02g | N/A |
| Phosphorus | 3mg | 4mg | 0% |
| Vitamin B3 | 0.04mg | 0.11mg | 0% |
| Folate | 0µg | 1µg | 0% |
| Choline | 2.1mg | 2.3mg | 0% |
| Saturated fat | 0.036g | 0g | 0% |
| Monounsaturated fat | 0.064g | 0g | 0% |
Macronutrient Comparison
| Contains more FatsFats | +∞% |
| Contains more WaterWater | +497% |
| Contains more OtherOther | +77.8% |
| Contains more ProteinProtein | +20% |
People also compare


References
All the values for which the sources are not specified explicitly are taken from FDA’s Food Central. The exact link to the food presented on this page can be found below.
- Maple sugar - https://fdc.nal.usda.gov/fdc-app.html#/food-details/169658/nutrients
- Brown sugar - https://fdc.nal.usda.gov/fdc-app.html#/food-details/168833/nutrients
All the Daily Values are presented for males aged 31-50, for 2000-calorie diets.