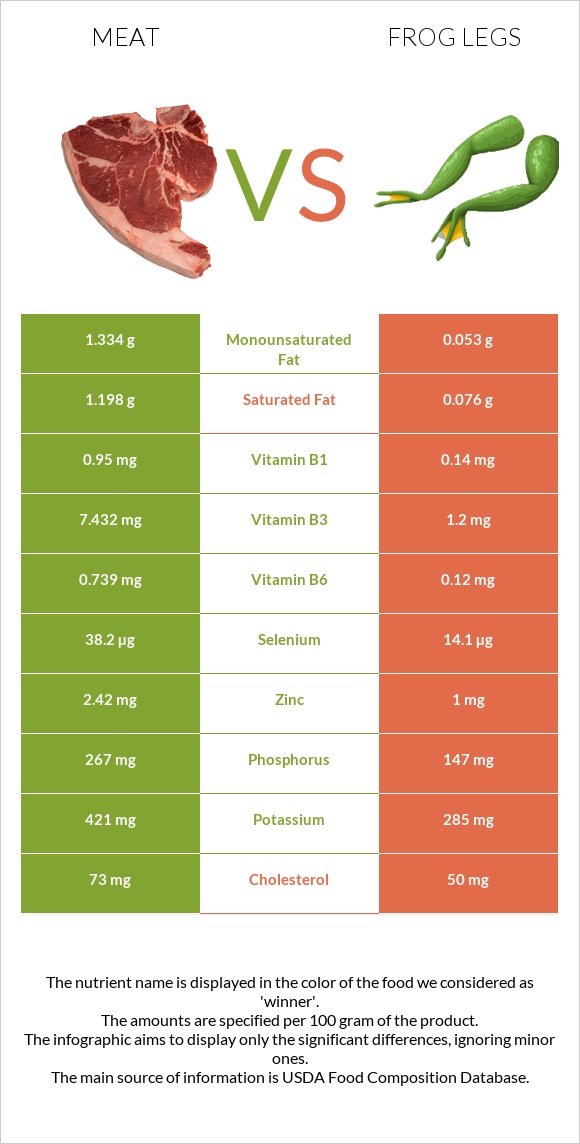
Differences between pork Meat and frog legs Pork Meat is higher in vitamin B1, vitamin B6, selenium, vitamin B3, phosphorus, zinc, vitamin B2, and vitamin B12; however, frog legs are richer in copper. Pork Meat's daily need coverage for vitamin B1 is 68% higher. Pork Meat has 6 times more vitamin B3 than frog legs. While pork Meat has 7.432mg of vitamin B3, frog legs have only 1.2mg. Frog legs have less cholesterol. The food types used in this comparison are Pork, fresh, loin, tenderloin, separable lean only, cooked, roasted and Frog legs, raw .
Infographic
Mineral Comparison
Mineral comparison score is based on the number of minerals by which one or the other food is richer. The "coverage" charts below show how much of the daily needs can be covered by 300 grams of the food.
6
100 g
300 g
3 oz - 85g 1 piece, cooked, excluding refuse (yield from 1 lb raw meat with refuse) - 333g 1 roast - 402g
Magnesium
Magnesium
Calcium
Calcium
Potassium
Potassium
Iron
Iron
Copper
Copper
Zinc
Zinc
Phosphorus
Phosphorus
Sodium
Sodium
Manganese
Manganese
Selenium
Selenium
21%
1.8%
37%
43%
37%
66%
114%
7.4%
1.7%
208%
3
100 g
300 g
1 leg - 45g
Magnesium
Magnesium
Calcium
Calcium
Potassium
Potassium
Iron
Iron
Copper
Copper
Zinc
Zinc
Phosphorus
Phosphorus
Sodium
Sodium
Manganese
Manganese
Selenium
Selenium
14%
5.4%
25%
56%
83%
27%
63%
7.6%
0%
77%
Vitamin Comparison
Vitamin comparison score is based on the number of vitamins by which one or the other food is richer. The "coverage" charts below show how much of the daily needs can be covered by 300 grams of the food.
6
100 g
300 g
3 oz - 85g 1 piece, cooked, excluding refuse (yield from 1 lb raw meat with refuse) - 333g 1 roast - 402g
Vitamin C
Vit. C
Vitamin D
Vit. D
Vitamin A
Vit. A
Vitamin E
Vit. E
Vitamin B1
Vit. B1
Vitamin B2
Vit. B2
Vitamin B3
Vit. B3
Vitamin B5
Vit. B5
Vitamin B6
Vit. B6
Vitamin B12
Vit. B12
Vitamin K
Vit. K
Folate
Folate
0%
3%
0%
1.6%
238%
89%
139%
61%
171%
71%
0%
0%
4
100 g
300 g
1 leg - 45g
Vitamin C
Vit. C
Vitamin D
Vit. D
Vitamin A
Vit. A
Vitamin E
Vit. E
Vitamin B1
Vit. B1
Vitamin B2
Vit. B2
Vitamin B3
Vit. B3
Vitamin B5
Vit. B5
Vitamin B6
Vit. B6
Vitamin B12
Vit. B12
Vitamin K
Vit. K
Folate
Folate
0%
3%
5%
20%
35%
58%
23%
0%
28%
50%
0.25%
11%
All nutrients comparison - raw data values
Nutrient
DV% diff.
Vitamin B1
0.95mg
0.14mg
68%
Vitamin B6
0.739mg
0.12mg
48%
Selenium
38.2µg
14.1µg
44%
Vitamin B3
7.432mg
1.2mg
39%
Protein
26.17g
16.4g
20%
Vitamin B5
1.012mg
20%
Phosphorus
267mg
147mg
17%
Copper
0.111mg
0.25mg
15%
Zinc
2.42mg
1mg
13%
Vitamin B2
0.387mg
0.25mg
11%
Cholesterol
73mg
50mg
8%
Vitamin B12
0.57µg
0.4µg
7%
Vitamin E
0.08mg
1mg
6%
Fats
3.51g
0.3g
5%
Saturated fat
1.198g
0.076g
5%
Calories
143kcal
73kcal
4%
Potassium
421mg
285mg
4%
Iron
1.15mg
1.5mg
4%
Folate
0µg
15µg
4%
Choline
88.9mg
65mg
4%
Monounsaturated fat
1.334g
0.053g
3%
Polyunsaturated fat
0.506g
0.102g
3%
Magnesium
29mg
20mg
2%
Vitamin A
0µg
15µg
2%
Calcium
6mg
18mg
1%
Manganese
0.013mg
1%
Protein per 100 calories
18g
22g
N/A
Calories per 10 g protein
55kcal
45kcal
N/A
Weight per 100 calories
70g
137g
N/A
Unsaturated / Saturated Fat ratio
1.5
2
N/A
Vitamin D*
10 IU
8 IU
0%
Vitamin D
0.2µg
0.2µg
0%
Sodium
57mg
58mg
0%
Vitamin K
0µg
0.1µg
0%
Trans fat
0.033g
N/A
Tryptophan
0.275mg
0%
Threonine
1.175mg
0%
Isoleucine
1.288mg
0%
Leucine
2.229mg
0%
Lysine
2.427mg
0%
Methionine
0.721mg
0%
Phenylalanine
1.1mg
0%
Valine
1.367mg
0%
Histidine
1.13mg
0%
Omega-3 - EPA
0g
0.014g
N/A
Omega-3 - DHA
0g
0.02g
N/A
Omega-3 - ALA
0.013g
N/A
Omega-3 - DPA
0g
0.007g
N/A
Omega-6 - Eicosadienoic acid
0.013g
N/A
Omega-6 - Linoleic acid
0.411g
N/A
Macronutrient Comparison
Macronutrient breakdown side-by-side comparison
2
26%
4%
69%
Protein:
26.17 g
Fats:
3.51 g
Carbs:
0 g
Water:
69.45 g
Other:
0.87 g
2
16%
82%
Protein:
16.4 g
Fats:
0.3 g
Carbs:
0 g
Water:
81.9 g
Other:
1.4 g
Contains
more
Protein Protein
+59.6%
Contains
more
Fats Fats
+1070%
Contains
more
Water Water
+17.9%
Contains
more
Other Other
+60.9%
Fat Type Comparison
Fat type breakdown side-by-side comparison
2
39%
44%
17%
Saturated fat:
Sat. Fat
1.198 g
Monounsaturated fat:
Mono. Fat
1.334 g
Polyunsaturated fat:
Poly. Fat
0.506 g
1
33%
23%
44%
Saturated fat:
Sat. Fat
0.076 g
Monounsaturated fat:
Mono. Fat
0.053 g
Polyunsaturated fat:
Poly. Fat
0.102 g
Contains
more
Mono. Fat Monounsaturated fat
+2417%
Contains
more
Poly. Fat Polyunsaturated fat
+396.1%
Contains
less
Sat. Fat Saturated fat
-93.7%