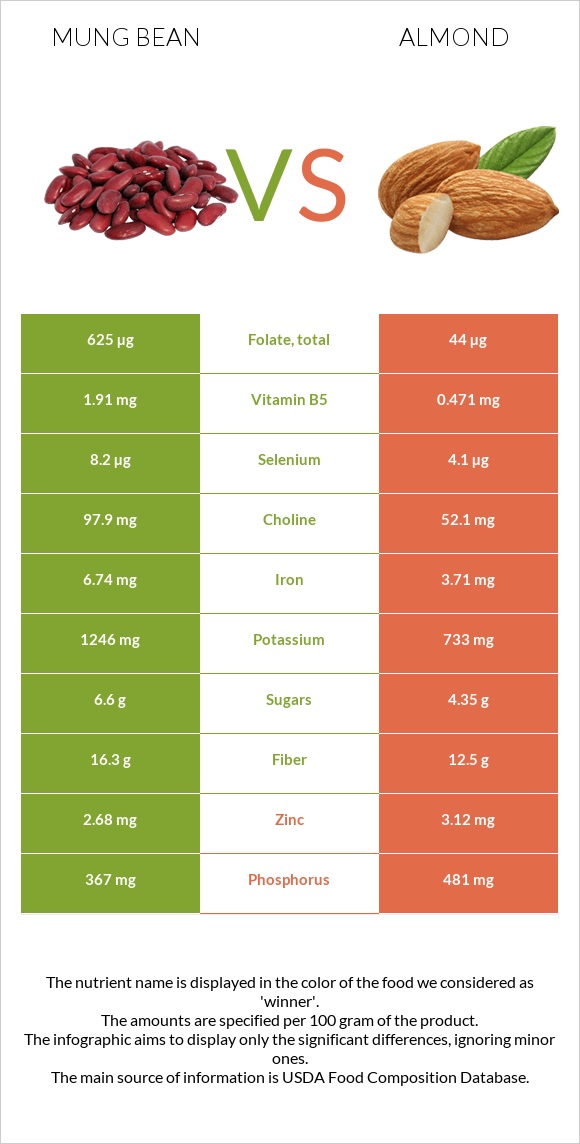
Differences between mung beans and almonds Mung beans are higher in folate, iron, vitamin B1, vitamin B5, and vitamin B6; however, almonds are richer in vitamin E, vitamin B2, manganese, and magnesium. Almonds' daily need coverage for vitamin E is 167% higher. Mung beans have 14 times more folate than almonds. While mung beans have 625µg of folate, almonds have only 44µg. Mung beans have less saturated fat. Almonds have a lower glycemic index (0) than mung beans (31). The food types used in this comparison are Mung beans, mature seeds, raw and Nuts, almonds .
Infographic
Mineral Comparison
Mineral comparison score is based on the number of minerals by which one or the other food is richer. The "coverage" charts below show how much of the daily needs can be covered by 300 grams of the food.
3
100 g
300 g
1 tbsp - 13g 1 cup - 207g
Magnesium
Magnesium
Calcium
Calcium
Potassium
Potassium
Iron
Iron
Copper
Copper
Zinc
Zinc
Phosphorus
Phosphorus
Sodium
Sodium
Manganese
Manganese
Selenium
Selenium
135%
40%
110%
253%
314%
73%
157%
2%
135%
45%
6
100 g
300 g
1 almond - 1.2g 1 oz (23 whole kernels) - 28.35g 1 cup, sliced - 92g 1 cup, ground - 95g 1 cup, slivered - 108g 1 cup, whole - 143g
Magnesium
Magnesium
Calcium
Calcium
Potassium
Potassium
Iron
Iron
Copper
Copper
Zinc
Zinc
Phosphorus
Phosphorus
Sodium
Sodium
Manganese
Manganese
Selenium
Selenium
193%
81%
65%
139%
344%
85%
206%
0.13%
284%
22%
Vitamin Comparison
Vitamin comparison score is based on the number of vitamins by which one or the other food is richer. The "coverage" charts below show how much of the daily needs can be covered by 300 grams of the food.
7
100 g
300 g
1 tbsp - 13g 1 cup - 207g
Vitamin C
Vit. C
Vitamin D
Vit. D
Vitamin A
Vit. A
Vitamin E
Vit. E
Vitamin B1
Vit. B1
Vitamin B2
Vit. B2
Vitamin B3
Vit. B3
Vitamin B5
Vit. B5
Vitamin B6
Vit. B6
Vitamin B12
Vit. B12
Vitamin K
Vit. K
Folate
Folate
16%
0%
2%
10%
155%
54%
42%
115%
88%
0%
23%
469%
3
100 g
300 g
1 almond - 1.2g 1 oz (23 whole kernels) - 28.35g 1 cup, sliced - 92g 1 cup, ground - 95g 1 cup, slivered - 108g 1 cup, whole - 143g
Vitamin C
Vit. C
Vitamin D
Vit. D
Vitamin A
Vit. A
Vitamin E
Vit. E
Vitamin B1
Vit. B1
Vitamin B2
Vit. B2
Vitamin B3
Vit. B3
Vitamin B5
Vit. B5
Vitamin B6
Vit. B6
Vitamin B12
Vit. B12
Vitamin K
Vit. K
Folate
Folate
0%
0%
0%
513%
51%
263%
68%
28%
32%
0%
0%
33%
All nutrients comparison - raw data values
Nutrient
DV% diff.
Vitamin E
0.51mg
25.63mg
167%
Folate
625µg
44µg
145%
Polyunsaturated fat
0.384g
12.329g
80%
Monounsaturated fat
0.161g
31.551g
78%
Fats
1.15g
49.93g
75%
Vitamin B2
0.233mg
1.138mg
70%
Manganese
1.035mg
2.179mg
50%
Iron
6.74mg
3.71mg
38%
Vitamin B1
0.621mg
0.205mg
35%
Vitamin B5
1.91mg
0.471mg
29%
Magnesium
189mg
270mg
19%
Vitamin B6
0.382mg
0.137mg
19%
Phosphorus
367mg
481mg
16%
Saturated fat
0.348g
3.802g
16%
Potassium
1246mg
733mg
15%
Fiber
16.3g
12.5g
15%
Carbs
62.62g
21.55g
14%
Calcium
132mg
269mg
14%
Calories
347kcal
579kcal
12%
Copper
0.941mg
1.031mg
10%
Vitamin B3
2.251mg
3.618mg
9%
Vitamin K
9µg
0µg
8%
Choline
97.9mg
52.1mg
8%
Selenium
8.2µg
4.1µg
7%
Protein
23.86g
21.15g
5%
Vitamin C
4.8mg
0mg
5%
Zinc
2.68mg
3.12mg
4%
Sodium
15mg
1mg
1%
Vitamin A
6µg
0µg
1%
Protein per 100 calories
6.9g
3.7g
N/A
Calories per 10 g protein
145kcal
274kcal
N/A
Weight per 100 calories
29g
17g
N/A
Unsaturated / Saturated Fat ratio
1.6
12
N/A
Net carbs
46.32g
9.05g
N/A
Sugar
6.6g
4.35g
N/A
Starch
0.72g
0%
Trans fat
0g
0.015g
N/A
Tryptophan
0.26mg
0.211mg
0%
Threonine
0.782mg
0.601mg
0%
Isoleucine
1.008mg
0.751mg
0%
Leucine
1.847mg
1.473mg
0%
Lysine
1.664mg
0.568mg
0%
Methionine
0.286mg
0.157mg
0%
Phenylalanine
1.443mg
1.132mg
0%
Valine
1.237mg
0.855mg
0%
Histidine
0.695mg
0.539mg
0%
Fructose
0.11g
0%
Omega-3 - ALA
0.003g
N/A
Omega-6 - Eicosadienoic acid
0.002g
N/A
Omega-6 - Linoleic acid
12.32g
N/A
Macronutrient Comparison
Macronutrient breakdown side-by-side comparison
4
24%
63%
9%
3%
Protein:
23.86 g
Fats:
1.15 g
Carbs:
62.62 g
Water:
9.05 g
Other:
3.32 g
1
21%
50%
22%
4%
3%
Protein:
21.15 g
Fats:
49.93 g
Carbs:
21.55 g
Water:
4.41 g
Other:
2.96 g
Contains
more
Protein Protein
+12.8%
Contains
more
Carbs Carbs
+190.6%
Contains
more
Water Water
+105.2%
Contains
more
Other Other
+12.2%
Contains
more
Fats Fats
+4241.7%
Fat Type Comparison
Fat type breakdown side-by-side comparison
1
39%
18%
43%
Saturated fat:
Sat. Fat
0.348 g
Monounsaturated fat:
Mono. Fat
0.161 g
Polyunsaturated fat:
Poly. Fat
0.384 g
2
8%
66%
26%
Saturated fat:
Sat. Fat
3.802 g
Monounsaturated fat:
Mono. Fat
31.551 g
Polyunsaturated fat:
Poly. Fat
12.329 g
Contains
less
Sat. Fat Saturated fat
-90.8%
Contains
more
Mono. Fat Monounsaturated fat
+19496.9%
Contains
more
Poly. Fat Polyunsaturated fat
+3110.7%