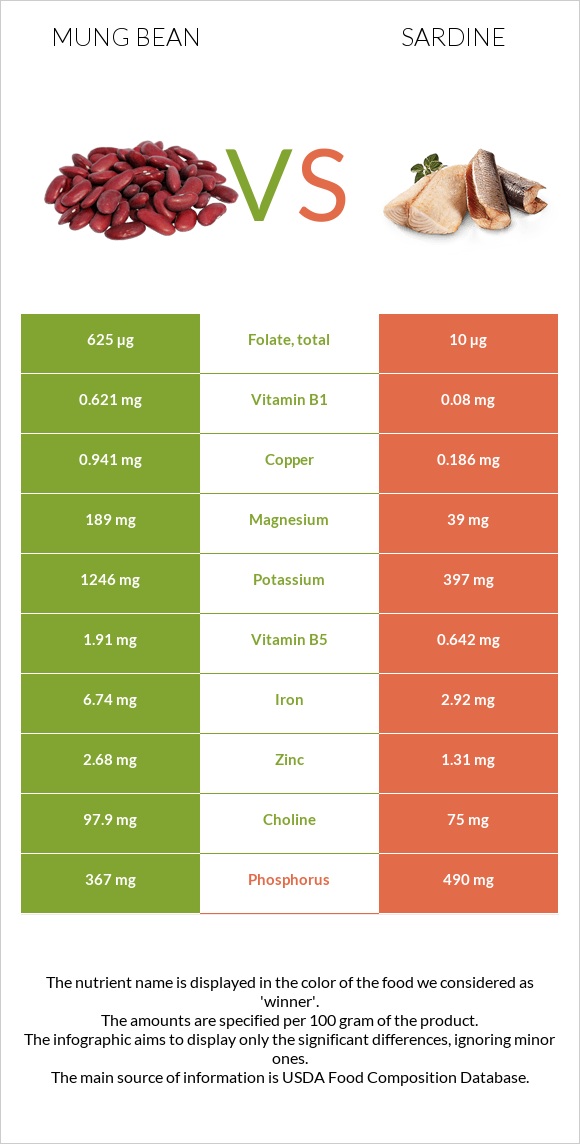
How are mung beans and sardines different? Mung beans are richer in folate, copper, fiber, iron, vitamin B1, manganese, and magnesium, while sardines are higher in vitamin B12 and selenium. Sardines cover your daily need for vitamin B12, 373% more than mung beans. Mung beans have a higher glycemic index (31) than sardines (0). Mung beans, mature seeds, raw and Fish, sardine, Atlantic, canned in oil, drained solids with bone types were used in this article.
Infographic
Mineral Comparison
Mineral comparison score is based on the number of minerals by which one or the other food is richer. The "coverage" charts below show how much of the daily needs can be covered by 300 grams of the food.
7
100 g
300 g
1 tbsp - 13g 1 cup - 207g
Magnesium
Magnesium
Calcium
Calcium
Potassium
Potassium
Iron
Iron
Copper
Copper
Zinc
Zinc
Phosphorus
Phosphorus
Sodium
Sodium
Manganese
Manganese
Selenium
Selenium
135%
40%
110%
253%
314%
73%
157%
2%
135%
45%
3
100 g
300 g
1 small (2-2/3" x 1/2" x 1/4") - 12g 1 cubic inch - 16g 2 sardines - 24g 1 oz - 28.35g 1 can (3.75 oz) - 92g 1 cup, drained - 149g
Magnesium
Magnesium
Calcium
Calcium
Potassium
Potassium
Iron
Iron
Copper
Copper
Zinc
Zinc
Phosphorus
Phosphorus
Sodium
Sodium
Manganese
Manganese
Selenium
Selenium
28%
115%
35%
110%
62%
36%
210%
40%
14%
287%
Vitamin Comparison
Vitamin comparison score is based on the number of vitamins by which one or the other food is richer. The "coverage" charts below show how much of the daily needs can be covered by 300 grams of the food.
6
100 g
300 g
1 tbsp - 13g 1 cup - 207g
Vitamin C
Vit. C
Vitamin D
Vit. D
Vitamin A
Vit. A
Vitamin E
Vit. E
Vitamin B1
Vit. B1
Vitamin B2
Vit. B2
Vitamin B3
Vit. B3
Vitamin B5
Vit. B5
Vitamin B6
Vit. B6
Vitamin B12
Vit. B12
Vitamin K
Vit. K
Folate
Folate
16%
0%
2%
10%
155%
54%
42%
115%
88%
0%
23%
469%
5
100 g
300 g
1 small (2-2/3" x 1/2" x 1/4") - 12g 1 cubic inch - 16g 2 sardines - 24g 1 oz - 28.35g 1 can (3.75 oz) - 92g 1 cup, drained - 149g
Vitamin C
Vit. C
Vitamin D
Vit. D
Vitamin A
Vit. A
Vitamin E
Vit. E
Vitamin B1
Vit. B1
Vitamin B2
Vit. B2
Vitamin B3
Vit. B3
Vitamin B5
Vit. B5
Vitamin B6
Vit. B6
Vitamin B12
Vit. B12
Vitamin K
Vit. K
Folate
Folate
0%
72%
11%
41%
20%
52%
98%
39%
39%
1118%
6.5%
7.5%
All nutrients comparison - raw data values
Nutrient
DV% diff.
Vitamin B12
0µg
8.94µg
373%
Folate
625µg
10µg
154%
Copper
0.941mg
0.186mg
84%
Selenium
8.2µg
52.7µg
81%
Fiber
16.3g
0g
65%
Iron
6.74mg
2.92mg
48%
Cholesterol
0mg
142mg
47%
Vitamin B1
0.621mg
0.08mg
45%
Manganese
1.035mg
0.108mg
40%
Magnesium
189mg
39mg
36%
Polyunsaturated fat
0.384g
5.148g
32%
Calcium
132mg
382mg
25%
Potassium
1246mg
397mg
25%
Vitamin B5
1.91mg
0.642mg
25%
Vitamin D*
0 IU
193 IU
24%
Vitamin D
0µg
4.8µg
24%
Carbs
62.62g
0g
21%
Vitamin B3
2.251mg
5.245mg
19%
Phosphorus
367mg
490mg
18%
Vitamin B6
0.382mg
0.167mg
17%
Fats
1.15g
11.45g
16%
Sodium
15mg
307mg
13%
Zinc
2.68mg
1.31mg
12%
Vitamin E
0.51mg
2.04mg
10%
Monounsaturated fat
0.161g
3.869g
9%
Calories
347kcal
208kcal
7%
Vitamin C
4.8mg
0mg
5%
Vitamin K
9µg
2.6µg
5%
Saturated fat
0.348g
1.528g
5%
Choline
97.9mg
75mg
4%
Vitamin A
6µg
32µg
3%
Protein
23.86g
24.62g
2%
Protein per 100 calories
6.9g
12g
N/A
Calories per 10 g protein
145kcal
84kcal
N/A
Weight per 100 calories
29g
48g
N/A
Unsaturated / Saturated Fat ratio
1.6
5.9
N/A
Net carbs
46.32g
0g
N/A
Sugar
6.6g
0g
N/A
Vitamin B2
0.233mg
0.227mg
0%
Tryptophan
0.26mg
0.276mg
0%
Threonine
0.782mg
1.079mg
0%
Isoleucine
1.008mg
1.134mg
0%
Leucine
1.847mg
2.001mg
0%
Lysine
1.664mg
2.26mg
0%
Methionine
0.286mg
0.729mg
0%
Phenylalanine
1.443mg
0.961mg
0%
Valine
1.237mg
1.268mg
0%
Histidine
0.695mg
0.725mg
0%
Omega-3 - EPA
0g
0.473g
N/A
Omega-3 - DHA
0g
0.509g
N/A
Macronutrient Comparison
Macronutrient breakdown side-by-side comparison
1
24%
63%
9%
3%
Protein:
23.86 g
Fats:
1.15 g
Carbs:
62.62 g
Water:
9.05 g
Other:
3.32 g
4
25%
11%
60%
4%
Protein:
24.62 g
Fats:
11.45 g
Carbs:
0 g
Water:
59.61 g
Other:
4.32 g
Contains
more
Carbs Carbs
+∞%
Contains
more
Fats Fats
+895.7%
Contains
more
Water Water
+558.7%
Contains
more
Other Other
+30.1%
~equal in
Protein
~24.62g
Fat Type Comparison
Fat type breakdown side-by-side comparison
1
39%
18%
43%
Saturated fat:
Sat. Fat
0.348 g
Monounsaturated fat:
Mono. Fat
0.161 g
Polyunsaturated fat:
Poly. Fat
0.384 g
2
14%
37%
49%
Saturated fat:
Sat. Fat
1.528 g
Monounsaturated fat:
Mono. Fat
3.869 g
Polyunsaturated fat:
Poly. Fat
5.148 g
Contains
less
Sat. Fat Saturated fat
-77.2%
Contains
more
Mono. Fat Monounsaturated fat
+2303.1%
Contains
more
Poly. Fat Polyunsaturated fat
+1240.6%