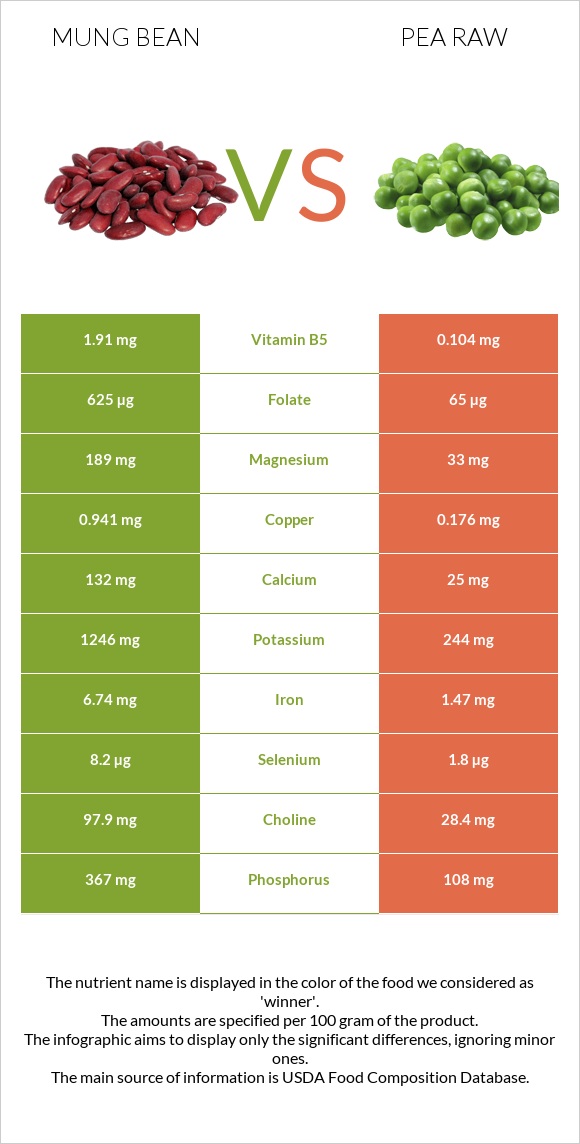
The main differences between mung beans and pea raw Mung beans have more folate, copper, iron, fiber, magnesium, phosphorus, vitamin B5, vitamin B1, and potassium; however, pea raw has more vitamin C. Daily need coverage for folate for mung beans is 140% higher. Pea raw has 18 times less vitamin B5 than mung beans. Mung beans have 1.91mg of vitamin B5, while pea raw has 0.104mg. Pea raw has a higher glycemic index than mung beans. Food types used in this article are Mung beans, mature seeds, raw and Peas, green, raw .
Infographic
Mineral Comparison
Mineral comparison score is based on the number of minerals by which one or the other food is richer. The "coverage" charts below show how much of the daily needs can be covered by 300 grams of the food.
9
100 g
300 g
1 tbsp - 13g 1 cup - 207g
Magnesium
Magnesium
Calcium
Calcium
Potassium
Potassium
Iron
Iron
Copper
Copper
Zinc
Zinc
Phosphorus
Phosphorus
Sodium
Sodium
Manganese
Manganese
Selenium
Selenium
135%
40%
110%
253%
314%
73%
157%
2%
135%
45%
1
100 g
300 g
1 cup - 145g
Magnesium
Magnesium
Calcium
Calcium
Potassium
Potassium
Iron
Iron
Copper
Copper
Zinc
Zinc
Phosphorus
Phosphorus
Sodium
Sodium
Manganese
Manganese
Selenium
Selenium
24%
7.5%
22%
55%
59%
34%
46%
0.65%
53%
9.8%
Vitamin Comparison
Vitamin comparison score is based on the number of vitamins by which one or the other food is richer. The "coverage" charts below show how much of the daily needs can be covered by 300 grams of the food.
6
100 g
300 g
1 tbsp - 13g 1 cup - 207g
Vitamin C
Vit. C
Vitamin D
Vit. D
Vitamin A
Vit. A
Vitamin E
Vit. E
Vitamin B1
Vit. B1
Vitamin B2
Vit. B2
Vitamin B3
Vit. B3
Vitamin B5
Vit. B5
Vitamin B6
Vit. B6
Vitamin B12
Vit. B12
Vitamin K
Vit. K
Folate
Folate
16%
0%
2%
10%
155%
54%
42%
115%
88%
0%
23%
469%
3
100 g
300 g
1 cup - 145g
Vitamin C
Vit. C
Vitamin D
Vit. D
Vitamin A
Vit. A
Vitamin E
Vit. E
Vitamin B1
Vit. B1
Vitamin B2
Vit. B2
Vitamin B3
Vit. B3
Vitamin B5
Vit. B5
Vitamin B6
Vit. B6
Vitamin B12
Vit. B12
Vitamin K
Vit. K
Folate
Folate
133%
0%
13%
2.6%
67%
30%
39%
6.2%
39%
0%
62%
49%
All nutrients comparison - raw data values
Nutrient
DV% diff.
Folate
625µg
65µg
140%
Copper
0.941mg
0.176mg
85%
Iron
6.74mg
1.47mg
66%
Fiber
16.3g
5.7g
42%
Vitamin C
4.8mg
40mg
39%
Protein
23.86g
5.42g
37%
Magnesium
189mg
33mg
37%
Phosphorus
367mg
108mg
37%
Vitamin B5
1.91mg
0.104mg
36%
Vitamin B1
0.621mg
0.266mg
30%
Potassium
1246mg
244mg
29%
Manganese
1.035mg
0.41mg
27%
Carbs
62.62g
14.45g
16%
Vitamin B6
0.382mg
0.169mg
16%
Calories
347kcal
81kcal
13%
Zinc
2.68mg
1.24mg
13%
Vitamin K
9µg
24.8µg
13%
Choline
97.9mg
28.4mg
13%
Selenium
8.2µg
1.8µg
12%
Calcium
132mg
25mg
11%
Vitamin B2
0.233mg
0.132mg
8%
Vitamin A
6µg
38µg
4%
Vitamin E
0.51mg
0.13mg
3%
Fats
1.15g
0.4g
1%
Vitamin B3
2.251mg
2.09mg
1%
Saturated fat
0.348g
0.071g
1%
Polyunsaturated fat
0.384g
0.187g
1%
Protein per 100 calories
6.9g
6.7g
N/A
Calories per 10 g protein
145kcal
149kcal
N/A
Weight per 100 calories
29g
123g
N/A
Net carbs
46.32g
8.75g
N/A
Sugar
6.6g
5.67g
N/A
Sodium
15mg
5mg
0%
Monounsaturated fat
0.161g
0.035g
0%
Tryptophan
0.26mg
0.037mg
0%
Threonine
0.782mg
0.203mg
0%
Isoleucine
1.008mg
0.195mg
0%
Leucine
1.847mg
0.323mg
0%
Lysine
1.664mg
0.317mg
0%
Methionine
0.286mg
0.082mg
0%
Phenylalanine
1.443mg
0.2mg
0%
Valine
1.237mg
0.235mg
0%
Histidine
0.695mg
0.107mg
0%
Fructose
0.39g
0%
Macronutrient Comparison
Macronutrient breakdown side-by-side comparison
4
24%
63%
9%
3%
Protein:
23.86 g
Fats:
1.15 g
Carbs:
62.62 g
Water:
9.05 g
Other:
3.32 g
1
5%
14%
79%
Protein:
5.42 g
Fats:
0.4 g
Carbs:
14.45 g
Water:
78.86 g
Other:
0.87 g
Contains
more
Protein Protein
+340.2%
Contains
more
Fats Fats
+187.5%
Contains
more
Carbs Carbs
+333.4%
Contains
more
Other Other
+281.6%
Contains
more
Water Water
+771.4%
Fat Type Comparison
Fat type breakdown side-by-side comparison
2
39%
18%
43%
Saturated fat:
Sat. Fat
0.348 g
Monounsaturated fat:
Mono. Fat
0.161 g
Polyunsaturated fat:
Poly. Fat
0.384 g
1
24%
12%
64%
Saturated fat:
Sat. Fat
0.071 g
Monounsaturated fat:
Mono. Fat
0.035 g
Polyunsaturated fat:
Poly. Fat
0.187 g
Contains
more
Mono. Fat Monounsaturated fat
+360%
Contains
more
Poly. Fat Polyunsaturated fat
+105.3%
Contains
less
Sat. Fat Saturated fat
-79.6%