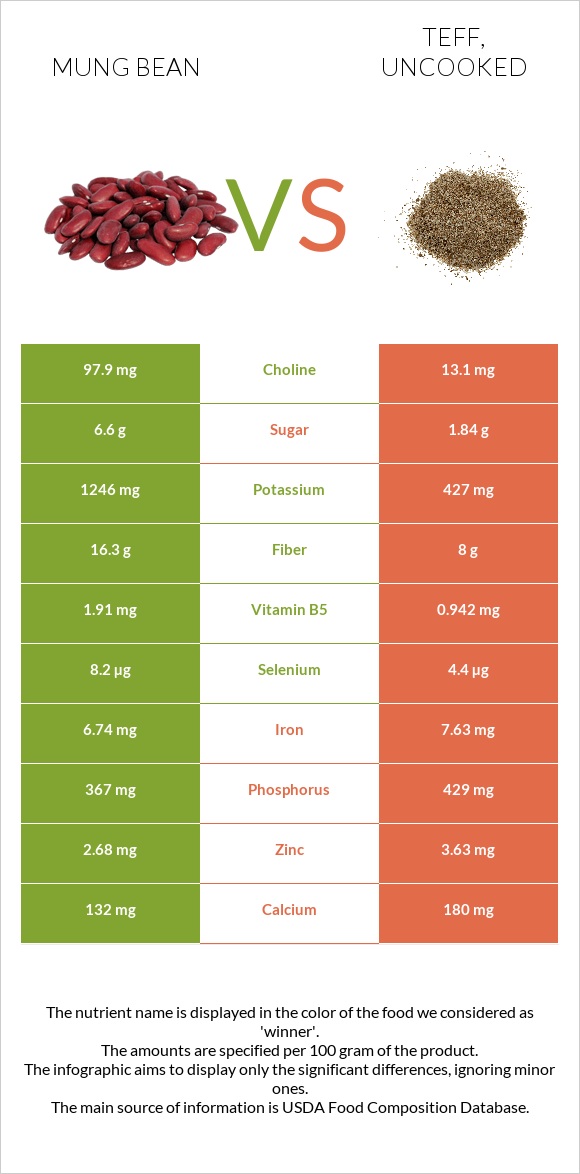
Important differences between mung beans and teff Mung beans have more fiber, potassium, vitamin B5, vitamin B1, choline, and copper; however, teff is richer in manganese, iron, phosphorus, and zinc. Teff's daily need coverage for manganese is 357% more. Mung beans contain 7 times more choline than teff. Mung beans contain 97.9mg of choline, while teff contains 13.1mg. The food varieties used in the comparison are Mung beans, mature seeds, raw and Teff, uncooked .
Infographic
Mineral Comparison
Mineral comparison score is based on the number of minerals by which one or the other food is richer. The "coverage" charts below show how much of the daily needs can be covered by 300 grams of the food.
3
100 g
300 g
1 tbsp - 13g 1 cup - 207g
Magnesium
Magnesium
Calcium
Calcium
Potassium
Potassium
Iron
Iron
Copper
Copper
Zinc
Zinc
Phosphorus
Phosphorus
Sodium
Sodium
Manganese
Manganese
Selenium
Selenium
135%
40%
110%
253%
314%
73%
157%
2%
135%
45%
6
100 g
300 g
1 cup - 193g
Magnesium
Magnesium
Calcium
Calcium
Potassium
Potassium
Iron
Iron
Copper
Copper
Zinc
Zinc
Phosphorus
Phosphorus
Sodium
Sodium
Manganese
Manganese
Selenium
Selenium
131%
54%
38%
286%
270%
99%
184%
1.6%
1205%
24%
Vitamin Comparison
Vitamin comparison score is based on the number of vitamins by which one or the other food is richer. The "coverage" charts below show how much of the daily needs can be covered by 300 grams of the food.
7
100 g
300 g
1 tbsp - 13g 1 cup - 207g
Vitamin C
Vit. C
Vitamin D
Vit. D
Vitamin A
Vit. A
Vitamin E
Vit. E
Vitamin B1
Vit. B1
Vitamin B2
Vit. B2
Vitamin B3
Vit. B3
Vitamin B5
Vit. B5
Vitamin B6
Vit. B6
Vitamin B12
Vit. B12
Vitamin K
Vit. K
Folate
Folate
16%
0%
2%
10%
155%
54%
42%
115%
88%
0%
23%
469%
3
100 g
300 g
1 cup - 193g
Vitamin C
Vit. C
Vitamin D
Vit. D
Vitamin A
Vit. A
Vitamin E
Vit. E
Vitamin B1
Vit. B1
Vitamin B2
Vit. B2
Vitamin B3
Vit. B3
Vitamin B5
Vit. B5
Vitamin B6
Vit. B6
Vitamin B12
Vit. B12
Vitamin K
Vit. K
Folate
Folate
0%
0%
0%
1.6%
98%
62%
63%
57%
111%
0%
4.8%
0%
All nutrients comparison - raw data values
Nutrient
DV% diff.
Manganese
1.035mg
9.24mg
357%
Folate
625µg
156%
Fiber
16.3g
8g
33%
Potassium
1246mg
427mg
24%
Protein
23.86g
13.3g
21%
Vitamin B1
0.621mg
0.39mg
19%
Vitamin B5
1.91mg
0.942mg
19%
Copper
0.941mg
0.81mg
15%
Starch
36.56g
15%
Choline
97.9mg
13.1mg
15%
Iron
6.74mg
7.63mg
11%
Zinc
2.68mg
3.63mg
9%
Phosphorus
367mg
429mg
9%
Vitamin B6
0.382mg
0.482mg
8%
Selenium
8.2µg
4.4µg
7%
Vitamin B3
2.251mg
3.363mg
7%
Vitamin K
9µg
1.9µg
6%
Vitamin C
4.8mg
5%
Calcium
132mg
180mg
5%
Polyunsaturated fat
0.384g
1.071g
5%
Carbs
62.62g
73.13g
4%
Vitamin E
0.51mg
0.08mg
3%
Vitamin B2
0.233mg
0.27mg
3%
Fats
1.15g
2.38g
2%
Calories
347kcal
367kcal
1%
Magnesium
189mg
184mg
1%
Vitamin A
6µg
0µg
1%
Monounsaturated fat
0.161g
0.589g
1%
Fructose
0.47g
1%
Protein per 100 calories
6.9g
3.6g
N/A
Calories per 10 g protein
145kcal
276kcal
N/A
Weight per 100 calories
29g
27g
N/A
Unsaturated / Saturated Fat ratio
1.6
3.7
N/A
Net carbs
46.32g
65.13g
N/A
Sugar
6.6g
1.84g
N/A
Sodium
15mg
12mg
0%
Saturated fat
0.348g
0.449g
0%
Tryptophan
0.26mg
0.139mg
0%
Threonine
0.782mg
0.51mg
0%
Isoleucine
1.008mg
0.501mg
0%
Leucine
1.847mg
1.068mg
0%
Lysine
1.664mg
0.376mg
0%
Methionine
0.286mg
0.428mg
0%
Phenylalanine
1.443mg
0.698mg
0%
Valine
1.237mg
0.686mg
0%
Histidine
0.695mg
0.301mg
0%
Omega-3 - ALA
0.135g
N/A
Macronutrient Comparison
Macronutrient breakdown side-by-side comparison
3
24%
63%
9%
3%
Protein:
23.86 g
Fats:
1.15 g
Carbs:
62.62 g
Water:
9.05 g
Other:
3.32 g
2
13%
2%
73%
9%
2%
Protein:
13.3 g
Fats:
2.38 g
Carbs:
73.13 g
Water:
8.82 g
Other:
2.37 g
Contains
more
Protein Protein
+79.4%
Contains
more
Other Other
+40.1%
Contains
more
Fats Fats
+107%
Contains
more
Carbs Carbs
+16.8%
Fat Type Comparison
Fat type breakdown side-by-side comparison
1
39%
18%
43%
Saturated fat:
Sat. Fat
0.348 g
Monounsaturated fat:
Mono. Fat
0.161 g
Polyunsaturated fat:
Poly. Fat
0.384 g
2
21%
28%
51%
Saturated fat:
Sat. Fat
0.449 g
Monounsaturated fat:
Mono. Fat
0.589 g
Polyunsaturated fat:
Poly. Fat
1.071 g
Contains
less
Sat. Fat Saturated fat
-22.5%
Contains
more
Mono. Fat Monounsaturated fat
+265.8%
Contains
more
Poly. Fat Polyunsaturated fat
+178.9%