Murray Vanilla Wafers vs. English muffins, plain, enriched, with ca prop (includes sourdough) — In-Depth Nutrition Comparison
Compare
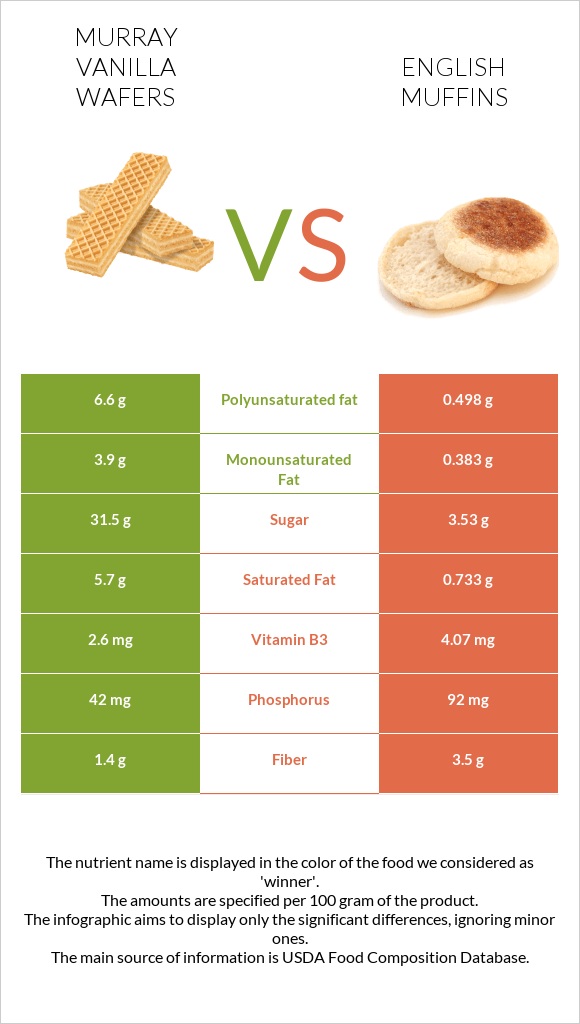
Differences between murray Vanilla Wafers and english muffins, plain, enriched, with ca prop (includes sourdough)
- Murray Vanilla Wafers have more polyunsaturated fat and monounsaturated fat, while english muffins, plain, enriched, with ca prop (includes sourdough) have more vitamin B3, fiber, and phosphorus.
- Murray Vanilla Wafers' daily need coverage for saturated fat is 25% higher.
- English muffins, plain, enriched, with ca prop (includes sourdough) contain 13 times less polyunsaturated fat than murray Vanilla Wafers. Murray Vanilla Wafers contain 6.6g of polyunsaturated fat, while english muffins, plain, enriched, with ca prop (includes sourdough) contain 0.498g.
- The amount of sugar in english muffins, plain, enriched, with ca prop (includes sourdough) is lower.
The food types used in this comparison are MURRAY, Vanilla Wafer and English muffins, plain, enriched, with ca prop (includes sourdough).
Infographic
Infographic link
Mineral Comparison
Mineral comparison score is based on the number of minerals by which one or the other food is richer. The "coverage" charts below show how much of the daily needs can be covered by 300 grams of the food.
| Contains more PotassiumPotassium | +29.8% |
| Contains more PhosphorusPhosphorus | +119% |
Vitamin Comparison
Vitamin comparison score is based on the number of vitamins by which one or the other food is richer. The "coverage" charts below show how much of the daily needs can be covered by 300 grams of the food.
| Contains more Vitamin B1Vitamin B1 | +13.6% |
| Contains more Vitamin B3Vitamin B3 | +56.5% |
All nutrients comparison - raw data values
| Nutrient |  |
 |
DV% diff. |
| Iron | 4mg | 50% | |
| Polyunsaturated fat | 6.6g | 0.498g | 41% |
| Selenium | 22.4µg | 41% | |
| Fats | 17.4g | 1.69g | 24% |
| Saturated fat | 5.7g | 0.733g | 23% |
| Manganese | 0.505mg | 22% | |
| Calcium | 163mg | 16% | |
| Methionine | 153mg | 15% | |
| Copper | 0.135mg | 15% | |
| Starch | 37.2g | 15% | |
| Calories | 461kcal | 227kcal | 12% |
| Carbs | 72.9g | 44.17g | 10% |
| Protein | 4g | 8.87g | 10% |
| Zinc | 1.05mg | 10% | |
| Monounsaturated fat | 3.9g | 0.383g | 9% |
| Vitamin B3 | 2.6mg | 4.07mg | 9% |
| Fiber | 1.4g | 3.5g | 8% |
| Phosphorus | 42mg | 92mg | 7% |
| Vitamin B5 | 0.363mg | 7% | |
| Magnesium | 24mg | 6% | |
| Vitamin B1 | 0.42mg | 0.477mg | 5% |
| Vitamin B6 | 0.054mg | 4% | |
| Choline | 16mg | 3% | |
| Folate | 88µg | 94µg | 2% |
| Vitamin B12 | 0.04µg | 2% | |
| Vitamin B2 | 0.23mg | 0.25mg | 2% |
| Vitamin E | 0.31mg | 2% | |
| Vitamin C | 1.8mg | 2% | |
| Sodium | 401mg | 425mg | 1% |
| Potassium | 84mg | 109mg | 1% |
| Vitamin K | 1.2µg | 1% | |
| Fructose | 0.69g | 1% | |
| Net carbs | 71.5g | 40.67g | N/A |
| Cholesterol | 1mg | 0mg | 0% |
| Sugar | 31.5g | 3.53g | N/A |
| Trans fat | 0.25g | 0g | N/A |
| Tryptophan | 0.108mg | 0% | |
| Threonine | 0.331mg | 0% | |
| Isoleucine | 0.404mg | 0% | |
| Leucine | 0.652mg | 0% | |
| Lysine | 0.45mg | 0% | |
| Phenylalanine | 0.417mg | 0% | |
| Valine | 0.454mg | 0% | |
| Histidine | 0.201mg | 0% | |
| Omega-3 - ALA | 0.048g | N/A |
Macronutrient Comparison
Macronutrient breakdown side-by-side comparison
Protein:
4 g
Fats:
17.4 g
Carbs:
72.9 g
Water:
4.1 g
Other:
1.6 g
Protein:
8.87 g
Fats:
1.69 g
Carbs:
44.17 g
Water:
43.56 g
Other:
1.71 g
| Contains more FatsFats | +929.6% |
| Contains more CarbsCarbs | +65% |
| Contains more ProteinProtein | +121.8% |
| Contains more WaterWater | +962.4% |
~equal in
Other
~1.71g
Fat Type Comparison
Fat type breakdown side-by-side comparison
Saturated fat:
Sat. Fat
5.7 g
Monounsaturated fat:
Mono. Fat
3.9 g
Polyunsaturated fat:
Poly. Fat
6.6 g
Saturated fat:
Sat. Fat
0.733 g
Monounsaturated fat:
Mono. Fat
0.383 g
Polyunsaturated fat:
Poly. Fat
0.498 g
| Contains more Mono. FatMonounsaturated fat | +918.3% |
| Contains more Poly. FatPolyunsaturated fat | +1225.3% |
| Contains less Sat. FatSaturated fat | -87.1% |