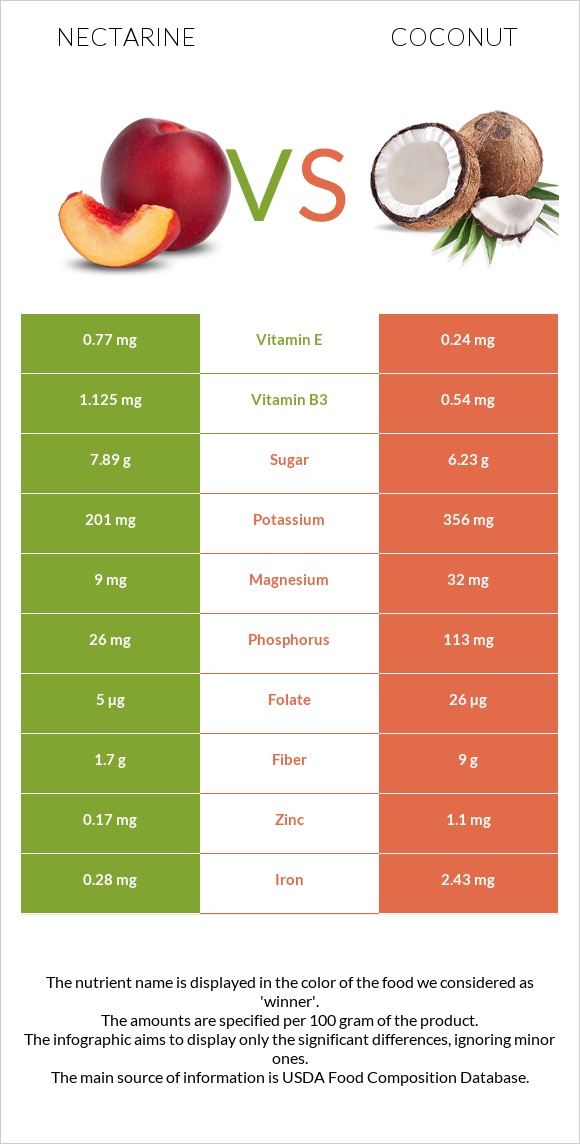
A recap on the differences between nectarine and coconut Nectarine has more vitamin A; however, coconut is higher in manganese, copper, fiber, iron, selenium, phosphorus, zinc, and magnesium. Coconut covers your daily saturated fat needs 148% more than nectarine. Nectarine has less saturated fat. The glycemic index of coconut is higher. Food varieties used in this article are Nectarines, raw and Nuts, coconut meat, raw .
Infographic
Mineral Comparison
Mineral comparison score is based on the number of minerals by which one or the other food is richer. The "coverage" charts below show how much of the daily needs can be covered by 300 grams of the food.
1
100 g
300 g
1 small (2-1/3" dia) - 129g 1 NLEA serving - 140g 1 medium (2-1/2" dia) - 142g 1 cup slices - 143g 1 large (2-3/4" dia) - 156g
Magnesium
Magnesium
Calcium
Calcium
Potassium
Potassium
Iron
Iron
Copper
Copper
Zinc
Zinc
Phosphorus
Phosphorus
Sodium
Sodium
Manganese
Manganese
Selenium
Selenium
6.4%
1.8%
18%
11%
29%
4.6%
11%
0%
7%
0%
9
100 g
300 g
1 piece (2" x 2" x 1/2") - 45g 1 cup, shredded - 80g 1 medium - 397g
Magnesium
Magnesium
Calcium
Calcium
Potassium
Potassium
Iron
Iron
Copper
Copper
Zinc
Zinc
Phosphorus
Phosphorus
Sodium
Sodium
Manganese
Manganese
Selenium
Selenium
23%
4.2%
31%
91%
145%
30%
48%
2.6%
196%
55%
Vitamin Comparison
Vitamin comparison score is based on the number of vitamins by which one or the other food is richer. The "coverage" charts below show how much of the daily needs can be covered by 300 grams of the food.
6
100 g
300 g
1 small (2-1/3" dia) - 129g 1 NLEA serving - 140g 1 medium (2-1/2" dia) - 142g 1 cup slices - 143g 1 large (2-3/4" dia) - 156g
Vitamin C
Vit. C
Vitamin D
Vit. D
Vitamin A
Vit. A
Vitamin E
Vit. E
Vitamin B1
Vit. B1
Vitamin B2
Vit. B2
Vitamin B3
Vit. B3
Vitamin B5
Vit. B5
Vitamin B6
Vit. B6
Vitamin B12
Vit. B12
Vitamin K
Vit. K
Folate
Folate
18%
0%
5.7%
15%
8.5%
6.2%
21%
11%
5.8%
0%
5.5%
3.8%
4
100 g
300 g
1 piece (2" x 2" x 1/2") - 45g 1 cup, shredded - 80g 1 medium - 397g
Vitamin C
Vit. C
Vitamin D
Vit. D
Vitamin A
Vit. A
Vitamin E
Vit. E
Vitamin B1
Vit. B1
Vitamin B2
Vit. B2
Vitamin B3
Vit. B3
Vitamin B5
Vit. B5
Vitamin B6
Vit. B6
Vitamin B12
Vit. B12
Vitamin K
Vit. K
Folate
Folate
11%
0%
0%
4.8%
17%
4.6%
10%
18%
12%
0%
0.5%
20%
All nutrients comparison - raw data values
Nutrient
DV% diff.
Saturated fat
0.025g
29.698g
135%
Manganese
0.054mg
1.5mg
63%
Fats
0.32g
33.49g
51%
Copper
0.086mg
0.435mg
39%
Fiber
1.7g
9g
29%
Iron
0.28mg
2.43mg
27%
Selenium
0µg
10.1µg
18%
Calories
44kcal
354kcal
16%
Phosphorus
26mg
113mg
12%
Zinc
0.17mg
1.1mg
8%
Protein
1.06g
3.33g
5%
Magnesium
9mg
32mg
5%
Potassium
201mg
356mg
5%
Folate
5µg
26µg
5%
Vitamin E
0.77mg
0.24mg
4%
Vitamin B3
1.125mg
0.54mg
4%
Vitamin B1
0.034mg
0.066mg
3%
Monounsaturated fat
0.088g
1.425g
3%
Vitamin C
5.4mg
3.3mg
2%
Carbs
10.55g
15.23g
2%
Vitamin A
17µg
0µg
2%
Vitamin B5
0.185mg
0.3mg
2%
Vitamin B6
0.025mg
0.054mg
2%
Vitamin K
2.2µg
0.2µg
2%
Polyunsaturated fat
0.113g
0.366g
2%
Fructose
1.37g
2%
Calcium
6mg
14mg
1%
Sodium
0mg
20mg
1%
Vitamin B2
0.027mg
0.02mg
1%
Choline
6.2mg
12.1mg
1%
Protein per 100 calories
2.4g
0.94g
N/A
Calories per 10 g protein
415kcal
1063kcal
N/A
Weight per 100 calories
227g
28g
N/A
Unsaturated / Saturated Fat ratio
8
0.06
N/A
Net carbs
8.85g
6.23g
N/A
Sugar
7.89g
6.23g
N/A
Starch
0.07g
0%
Tryptophan
0.005mg
0.039mg
0%
Threonine
0.009mg
0.121mg
0%
Isoleucine
0.009mg
0.131mg
0%
Leucine
0.014mg
0.247mg
0%
Lysine
0.016mg
0.147mg
0%
Methionine
0.006mg
0.062mg
0%
Phenylalanine
0.021mg
0.169mg
0%
Valine
0.013mg
0.202mg
0%
Histidine
0.008mg
0.077mg
0%
Macronutrient Comparison
Macronutrient breakdown side-by-side comparison
1
11%
88%
Protein:
1.06 g
Fats:
0.32 g
Carbs:
10.55 g
Water:
87.59 g
Other:
0.48 g
4
3%
33%
15%
47%
Protein:
3.33 g
Fats:
33.49 g
Carbs:
15.23 g
Water:
46.99 g
Other:
0.96 g
Contains
more
Water Water
+86.4%
Contains
more
Protein Protein
+214.2%
Contains
more
Fats Fats
+10365.6%
Contains
more
Carbs Carbs
+44.4%
Contains
more
Other Other
+100%
Fat Type Comparison
Fat type breakdown side-by-side comparison
1
11%
39%
50%
Saturated fat:
Sat. Fat
0.025 g
Monounsaturated fat:
Mono. Fat
0.088 g
Polyunsaturated fat:
Poly. Fat
0.113 g
2
94%
5%
Saturated fat:
Sat. Fat
29.698 g
Monounsaturated fat:
Mono. Fat
1.425 g
Polyunsaturated fat:
Poly. Fat
0.366 g
Contains
less
Sat. Fat Saturated fat
-99.9%
Contains
more
Mono. Fat Monounsaturated fat
+1519.3%
Contains
more
Poly. Fat Polyunsaturated fat
+223.9%