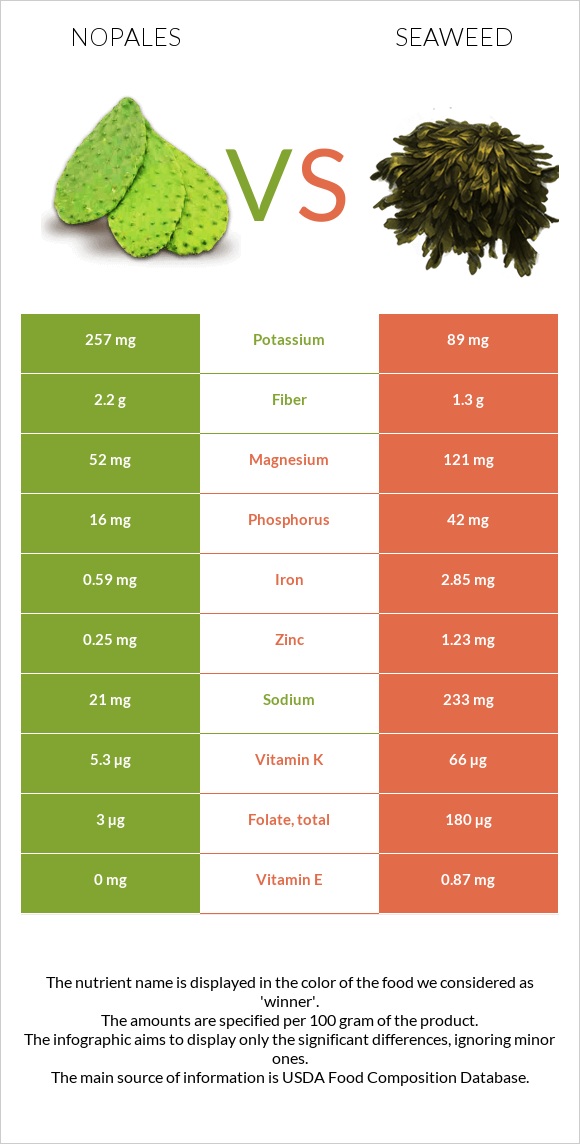
How are nopales and seaweed different? Nopales are richer in manganese, while seaweed is higher in vitamin K, folate, iron, magnesium, vitamin B5, zinc, copper, and vitamin B2. Seaweed covers your daily need for vitamin K, 51% more than nopales. Nopales contain 2 times more manganese than seaweed. Nopales contain 0.457mg of manganese, while seaweed contains 0.2mg. Nopales are lower in sodium. Nopales, raw and Seaweed, kelp, raw types were used in this article.
Infographic
Mineral Comparison
Mineral comparison score is based on the number of minerals by which one or the other food is richer. The "coverage" charts below show how much of the daily needs can be covered by 300 grams of the food.
3
100 g
300 g
1 cup, sliced - 86g
Magnesium
Magnesium
Calcium
Calcium
Potassium
Potassium
Iron
Iron
Copper
Copper
Zinc
Zinc
Phosphorus
Phosphorus
Sodium
Sodium
Manganese
Manganese
Selenium
Selenium
37%
49%
23%
22%
17%
6.8%
6.9%
2.7%
60%
3.8%
5
100 g
300 g
2 tbsp (1/8 cup) - 10g
Magnesium
Magnesium
Calcium
Calcium
Potassium
Potassium
Iron
Iron
Copper
Copper
Zinc
Zinc
Phosphorus
Phosphorus
Sodium
Sodium
Manganese
Manganese
Selenium
Selenium
86%
50%
7.9%
107%
43%
34%
18%
30%
26%
3.8%
Vitamin Comparison
Vitamin comparison score is based on the number of vitamins by which one or the other food is richer. The "coverage" charts below show how much of the daily needs can be covered by 300 grams of the food.
3
100 g
300 g
1 cup, sliced - 86g
Vitamin C
Vit. C
Vitamin D
Vit. D
Vitamin A
Vit. A
Vitamin E
Vit. E
Vitamin B1
Vit. B1
Vitamin B2
Vit. B2
Vitamin B3
Vit. B3
Vitamin B5
Vit. B5
Vitamin B6
Vit. B6
Vitamin B12
Vit. B12
Vitamin K
Vit. K
Folate
Folate
31%
0%
7.7%
0%
3%
9.5%
7.7%
10%
16%
0%
13%
2.3%
7
100 g
300 g
2 tbsp (1/8 cup) - 10g
Vitamin C
Vit. C
Vitamin D
Vit. D
Vitamin A
Vit. A
Vitamin E
Vit. E
Vitamin B1
Vit. B1
Vitamin B2
Vit. B2
Vitamin B3
Vit. B3
Vitamin B5
Vit. B5
Vitamin B6
Vit. B6
Vitamin B12
Vit. B12
Vitamin K
Vit. K
Folate
Folate
10%
0%
2%
17%
13%
35%
8.8%
39%
0.46%
0%
165%
135%
All nutrients comparison - raw data values
Nutrient
DV% diff.
Vitamin K
5.3µg
66µg
51%
Folate
3µg
180µg
44%
Iron
0.59mg
2.85mg
28%
Magnesium
52mg
121mg
16%
Manganese
0.457mg
0.2mg
11%
Vitamin B5
0.167mg
0.642mg
10%
Copper
0.052mg
0.13mg
9%
Zinc
0.25mg
1.23mg
9%
Sodium
21mg
233mg
9%
Vitamin B2
0.041mg
0.15mg
8%
Vitamin C
9.3mg
3mg
7%
Vitamin E
0mg
0.87mg
6%
Potassium
257mg
89mg
5%
Vitamin B6
0.07mg
0.002mg
5%
Fiber
2.2g
1.3g
4%
Phosphorus
16mg
42mg
4%
Vitamin B1
0.012mg
0.05mg
3%
Carbs
3.33g
9.57g
2%
Vitamin A
23µg
6µg
2%
Calories
16kcal
43kcal
1%
Protein
1.32g
1.68g
1%
Fats
0.09g
0.56g
1%
Choline
7.3mg
12.8mg
1%
Saturated fat
0.016g
0.247g
1%
Protein per 100 calories
8.3g
3.9g
N/A
Calories per 10 g protein
121kcal
256kcal
N/A
Weight per 100 calories
625g
233g
N/A
Net carbs
1.13g
8.27g
N/A
Calcium
164mg
168mg
0%
Sugar
1.15g
0.6g
N/A
Selenium
0.7µg
0.7µg
0%
Vitamin B3
0.41mg
0.47mg
0%
Monounsaturated fat
0.018g
0.098g
0%
Polyunsaturated fat
0.05g
0.047g
0%
Tryptophan
0.014mg
0.048mg
0%
Threonine
0.04mg
0.055mg
0%
Isoleucine
0.049mg
0.076mg
0%
Leucine
0.077mg
0.083mg
0%
Lysine
0.059mg
0.082mg
0%
Methionine
0.015mg
0.025mg
0%
Phenylalanine
0.049mg
0.043mg
0%
Valine
0.059mg
0.072mg
0%
Histidine
0.025mg
0.024mg
0%
Omega-3 - EPA
0g
0.004g
N/A
Macronutrient Comparison
Macronutrient breakdown side-by-side comparison
1
3%
94%
Protein:
1.32 g
Fats:
0.09 g
Carbs:
3.33 g
Water:
94.12 g
Other:
1.14 g
4
2%
10%
82%
7%
Protein:
1.68 g
Fats:
0.56 g
Carbs:
9.57 g
Water:
81.58 g
Other:
6.61 g
Contains
more
Water Water
+15.4%
Contains
more
Protein Protein
+27.3%
Contains
more
Fats Fats
+522.2%
Contains
more
Carbs Carbs
+187.4%
Contains
more
Other Other
+479.8%
Fat Type Comparison
Fat type breakdown side-by-side comparison
2
19%
21%
60%
Saturated fat:
Sat. Fat
0.016 g
Monounsaturated fat:
Mono. Fat
0.018 g
Polyunsaturated fat:
Poly. Fat
0.05 g
1
63%
25%
12%
Saturated fat:
Sat. Fat
0.247 g
Monounsaturated fat:
Mono. Fat
0.098 g
Polyunsaturated fat:
Poly. Fat
0.047 g
Contains
less
Sat. Fat Saturated fat
-93.5%
Contains
more
Mono. Fat Monounsaturated fat
+444.4%
~equal in
Polyunsaturated fat
~0.047g