Brazil nut vs. Walnut — Nutrition Comparison & Health Impact


Summary
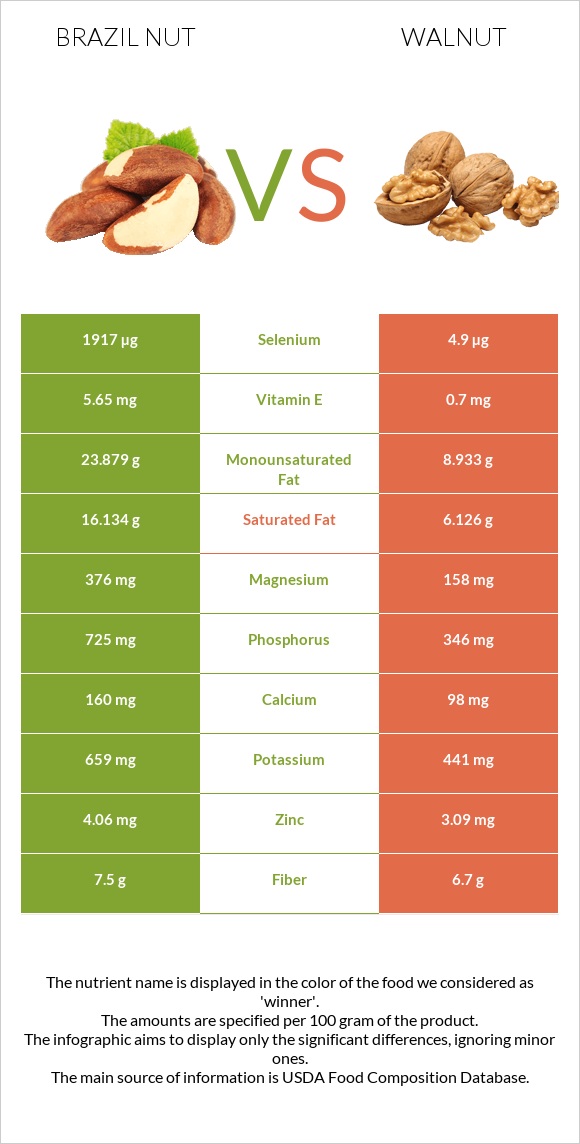
Compared to walnuts, Brazil nuts are higher in copper, vitamin B1, vitamin E, phosphorus, magnesium, and selenium. Specifically, Brazil nuts are an exceptional source of selenium, offering an astounding 3477% higher content than walnuts. Furthermore, Brazil nuts include 5.65 mg of vitamin E compared to 0.7 mg in walnuts, which is eight times higher than in walnuts. But walnuts win out regarding manganese, vitamin B6, and folate. Walnuts are less saturated than Brazil nuts in terms of nutrition.
Introduction
This post will discuss the variations between walnuts and Brazil nuts. These are both well-known. Among the most popular snacks are these nuts; today, we'll go further to discover which are better than the others and what the nutritional and health distinctions are.
Classification
According to botanical theory, neither Brazil nuts nor walnuts are nuts. Within the Juglans genus and Juglandaceae family, walnuts are classified as stone fruits or drupes. Other trees, like hickory and pecan, belong to this family. Conversely, Brazil nuts come from the seeds of the Lecythidaceae family tree, Bertholletia excelsa. Despite not being wild according to botany, both are frequently referred to as nuts in culinary contexts because of their use in cooking.
Appearance
Walnuts, specifically English or Persian walnuts, are smaller than Brazil nuts. They have a hard, woody shell that is generally light brown. When cracked open, the walnut kernel inside is two-lobed, resembling a miniature brain. The kernel has a light tan color and a characteristic wrinkled appearance. Brazil nuts have a more prominent, rounder appearance with a dark, textured outer shell, while walnuts are smaller with a light brown, two-lobed kernel inside a hard shell.
Taste and Use
Brazil nuts are distinct in flavor, with a rich, creamy, and slightly sweet taste, often noted for their smooth, buttery texture. They are commonly enjoyed as a snack or used in various culinary applications, including desserts and salads. On the other hand, walnuts have a mild earthy flavor, with the possibility of the skin having a slightly bitter taste. Nut milk can be a fantastic alternative for those allergic to milk or have lactose sensitivities.
Varieties
When comparing walnuts and Brazil nuts, it's important to note that, unlike walnuts, Brazil nuts are primarily associated with the Bertholletia excelsa tree, native to South America. Discussions about Brazil nuts usually revolve around this specific species. On the other hand, walnuts, particularly Persian or English walnuts, encompass various varieties like black walnut, Californian walnut, and butternut, each with unique characteristics and nutritional values. These nuts' general traits and nutritional content differ based on their variety and cultivar.
Nutrition
The nutritional values for Brazil nuts and walnuts are shown below.
Macronutrients and Calories
Brazil nuts and walnuts are both highly nutrient-dense foods.
Macronutrient Comparison
Contains
more
OtherOther
+92.1%
Contains
more
CarbsCarbs
+16.8%
Contains
more
WaterWater
+19%
Calories
Brazil nuts and walnuts are both high in calories. The calories in walnuts and Brazil nuts are 654 and 659, respectively.
Protein
Nuts are an excellent source of premium protein. Brazil nuts have 14.32g of protein, whereas walnuts have 15.23g. All of the necessary amino acids are in high concentrations in these two nuts.
Fats
Brazil nuts and walnuts provide 65g and 67g of fat per hundred grams, respectively.
Brazil nuts have much more saturated and monounsaturated fats than walnuts despite having higher amounts of polyunsaturated fat. Regarding omega-6 fatty acids, Brazil nuts have 23g, while walnuts have a higher content at 38.1g. Walnuts are significantly richer in omega-3 fatty acids, containing 9g of alpha-linolenic acid (ALA) in every 100-gram serving. In contrast, Brazil nuts have a much lower omega-3 content, with only 0.018g of ALA. Because they are plant-based foods, Brazil nuts and walnuts don't contain any cholesterol.
Fat Type Comparison
Contains
more
Mono. FatMonounsaturated fat
+167.3%
Contains
less
Sat. FatSaturated fat
-62%
Contains
more
Poly. FatPolyunsaturated fat
+93.3%
Carbohydrates
Regarding carbohydrates, walnuts are higher than Brazil nuts. Whereas walnuts provide 13.71g of carbohydrates, Brazil nuts have 11.74g. Their dietary fiber content is almost identical. Walnuts provide 6.7g of fiber, whereas Brazil nuts have 7.5g.
Carbohydrate type comparison
Contains
more
StarchStarch
+316.7%
Contains
more
GlucoseGlucose
+∞%
Contains
more
FructoseFructose
+∞%
Vitamins
Brazil nuts have a higher percentage of daily values for some vitamins, such as vitamin B1 and vitamin E, despite walnuts having a more varied vitamin content.
Walnuts are higher in folate, vitamin A, vitamin B2 (riboflavin), vitamin B6, vitamin B3 (niacin), vitamin B5, vitamin C, and vitamin K.
Vitamin Comparison
Contains
more
Vitamin EVitamin E
+707.1%
Contains
more
Vitamin B1Vitamin B1
+80.9%
Contains
more
Vitamin CVitamin C
+85.7%
Contains
more
Vitamin AVitamin A
+∞%
Contains
more
Vitamin B2Vitamin B2
+328.6%
Contains
more
Vitamin B3Vitamin B3
+281.4%
Contains
more
Vitamin B5Vitamin B5
+209.8%
Contains
more
Vitamin B6Vitamin B6
+431.7%
Contains
more
Vitamin KVitamin K
+∞%
Contains
more
FolateFolate
+345.5%
Minerals
The copper, sodium, and iron content of both nuts is the same.
Compared to walnuts, brazil nuts are higher in zinc, phosphorus, potassium, selenium, calcium, and magnesium. Conversely, walnuts contain a higher manganese content.
Brazil nuts have a much higher selenium content—39191% more than you would require daily—than walnuts.
Mineral Comparison
Contains
more
MagnesiumMagnesium
+138%
Contains
more
CalciumCalcium
+63.3%
Contains
more
PotassiumPotassium
+49.4%
Contains
more
ZincZinc
+31.4%
Contains
more
PhosphorusPhosphorus
+109.5%
Contains
more
SeleniumSelenium
+39022.4%
Contains
more
IronIron
+19.8%
Contains
less
SodiumSodium
-33.3%
Contains
more
ManganeseManganese
+179.1%
Oxalates
Although specific information about Brazil nuts' oxalate level is unavailable, walnuts have an oxalate content of 54 mg per 100 grams. It is believed that walnuts contain a lot of oxalates.
Glycemic Index
Both walnuts and Brazil nuts are low-glycemic foods; walnuts have a low-glycemic index of 0, while Brazil nuts have an index of 10, regarded as low. This suggests that eating these nuts has little effect on blood sugar levels.
Acidity
Brazil nuts are closer to 6.5 in acidity, while walnuts have a pH value of 5.42, which is more acidic. Estimating the potential renal acid load (PRAL) of the diet, which is dependent on dietary intakes of protein and mineral ions, may also measure the acidic impact of food.
In this instance, walnuts had a PRAL value of 5.6, which is regarded as acid-forming. Brazil nuts have a PRAL score of 8.1, which makes them more acid-forming than walnuts.
Weight Loss and Diets
Walnuts and Brazil nuts have many calories, just like most other nuts. However, these nuts may be a valuable part of a balanced diet because they are high in dietary fiber, protein, and healthy fats.
Numerous studies have found that, compared to identical hypocaloric diets without these nuts, adding walnuts or Brazil nuts to reduced-calorie diets results in a more desired and healthy weight reduction (1, 2). Consuming nuts regularly as a snack for less nutritious meals may also help avoid obesity (3).
Health Benefits
Cardiovascular Health
Both walnuts and Brazil nuts are beneficial for heart health. Walnuts have been extensively studied and have been found to reduce the risk of cardiovascular disease by lowering "bad" LDL cholesterol, blood pressure, oxidative stress, and markers of inflammation (4).
On the other hand, Brazil nuts are rich in heart-healthy polyunsaturated fats, antioxidants, minerals, and fibers. Additionally, they may reduce "bad" LDL cholesterol, increase "good" HDL cholesterol, and improve blood vessel function (5, 6, 7).
While walnuts are known to offer a broad range of cardiovascular benefits, Brazil nuts contribute to heart health through their high selenium content, which can decrease the risk of heart remodeling (8,9).
Diabetes
A lower incidence of type 2 diabetes has been connected to greater walnut consumption, particularly in women (10,11). It's important to remember that an increased risk of diabetes has been linked to excessive selenium intake from Brazil nuts, primarily through supplements (12).
Inflammation
Walnuts contain polyphenols, particularly ellagitannins, which, when converted to urolithins by gut bacteria, have protective effects against inflammation. Additionally, walnuts' ALA, omega-3 fats, magnesium, and arginine further reduce inflammation (13). On the other hand, Brazil nuts are rich in antioxidants, including selenium, vitamin E, and phenols like gallic acid and ellagic acid. Selenium, in particular, increases the activity of glutathione peroxidase, an enzyme that helps combat inflammation and oxidative stress (14).
Cancer
Walnuts, enriched with various compounds, show promise in preventing or reducing the risk of breast, prostate, colon, and renal cancers (15). On the other hand, while selenium is present in Brazil nuts and has been associated with potential benefits, excessive intake from supplements has been connected to a higher chance of prostate cancer (16).
Brain Health
Both walnuts and Brazil nuts offer potential benefits for brain health, albeit through different components. Walnuts, rich in antioxidants and anti-inflammatory compounds, have been associated with improved cognition and a reduced risk of mild cognitive impairment and Alzheimer's disease (17,18). On the other hand, Brazil nuts contain ellagic acid and selenium, with the latter showing potential for reducing the risk of certain brain diseases and enhancing mental performance and mood (19,20,21).
Downsides and Risks
Allergy
Allergies to tree nuts are widespread and frequently severe (22).
We don't know the allergy's precise etiology. Since the skins and hearts of nuts are frequently removed during processing, the cotyledons—parts of the seed embryo—are most likely the primary source of allergens for most people.
In addition to asthma and anaphylactic shock, symptoms may include vomiting, diarrhea, urticaria, and angioedema (swelling of the lips, face, throat, and skin).
Sources
- https://www.ncbi.nlm.nih.gov/pmc/
- https://www.ncbi.nlm.nih.gov/pmc/
- https://www.ncbi.nlm.nih.gov/pmc/
- https://pubmed.ncbi.nlm.nih.gov/24500935/
- https://pubmed.ncbi.nlm.nih.gov/21619692/
- https://pubmed.ncbi.nlm.nih.gov/22749175/
- https://pubmed.ncbi.nlm.nih.gov/23840948/
- https://www.sciencedirect.com/science/
- https://pubmed.ncbi.nlm.nih.gov/35987147/
- https://www.ncbi.nlm.nih.gov/pmc/
- https://www.ncbi.nlm.nih.gov/pmc/
- https://pubmed.ncbi.nlm.nih.gov/22381456/
- https://www.ncbi.nlm.nih.gov/pmc/
- https://www.sciencedirect.com/science/
- https://www.ncbi.nlm.nih.gov/pmc/
- https://pubmed.ncbi.nlm.nih.gov/29376219/
- https://pubmed.ncbi.nlm.nih.gov/32093220/
- https://pubmed.ncbi.nlm.nih.gov/17125534/
- https://pubmed.ncbi.nlm.nih.gov/26846140/
- https://pubmed.ncbi.nlm.nih.gov/29017372/
- https://pubmed.ncbi.nlm.nih.gov/25567069/
- https://www.ncbi.nlm.nih.gov/pmc/

Infographic
All nutrients comparison - raw data values
| Nutrient | |
|
DV% diff. |
| Selenium | 1917µg | 4.9µg | 3477% |
| Polyunsaturated fat | 24.399g | 47.174g | 152% |
| Manganese | 1.223mg | 3.414mg | 95% |
| Phosphorus | 725mg | 346mg | 54% |
| Magnesium | 376mg | 158mg | 52% |
| Saturated fat | 16.134g | 6.126g | 45% |
| Monounsaturated fat | 23.879g | 8.933g | 37% |
| Vitamin B6 | 0.101mg | 0.537mg | 34% |
| Vitamin E | 5.65mg | 0.7mg | 33% |
| Vitamin B1 | 0.617mg | 0.341mg | 23% |
| Folate | 22µg | 98µg | 19% |
| Copper | 1.743mg | 1.586mg | 17% |
| Zinc | 4.06mg | 3.09mg | 9% |
| Vitamin B2 | 0.035mg | 0.15mg | 9% |
| Vitamin B5 | 0.184mg | 0.57mg | 8% |
| Calcium | 160mg | 98mg | 6% |
| Potassium | 659mg | 441mg | 6% |
| Iron | 2.43mg | 2.91mg | 6% |
| Vitamin B3 | 0.295mg | 1.125mg | 5% |
| Fats | 67.1g | 65.21g | 3% |
| Fiber | 7.5g | 6.7g | 3% |
| Protein | 14.32g | 15.23g | 2% |
| Vitamin K | 0µg | 2.7µg | 2% |
| Choline | 28.8mg | 39.2mg | 2% |
| Vitamin C | 0.7mg | 1.3mg | 1% |
| Carbs | 11.74g | 13.71g | 1% |
| Calories | 659kcal | 654kcal | 0% |
| Protein per 100 calories | 2.2g | 2.3g | N/A |
| Calories per 10 g protein | 460kcal | 429kcal | N/A |
| Weight per 100 calories | 15g | 15g | N/A |
| Unsaturated / Saturated Fat ratio | 3 | 9.2 | N/A |
| Net carbs | 4.24g | 7.01g | N/A |
| Sugar | 2.33g | 2.61g | N/A |
| Starch | 0.25g | 0.06g | 0% |
| Sodium | 3mg | 2mg | 0% |
| Vitamin A | 0µg | 1µg | 0% |
| Tryptophan | 0.135mg | 0.17mg | 0% |
| Threonine | 0.365mg | 0.596mg | 0% |
| Isoleucine | 0.518mg | 0.625mg | 0% |
| Leucine | 1.19mg | 1.17mg | 0% |
| Lysine | 0.49mg | 0.424mg | 0% |
| Methionine | 1.124mg | 0.236mg | 0% |
| Phenylalanine | 0.639mg | 0.711mg | 0% |
| Valine | 0.76mg | 0.753mg | 0% |
| Histidine | 0.409mg | 0.391mg | 0% |
| Fructose | 0g | 0.09g | 0% |
| Omega-3 - ALA | 0.018g | N/A | |
| Omega-6 - Gamma-linoleic acid | 0.018g | N/A | |
| Omega-6 - Linoleic acid | 23.859g | N/A |
People also compare


References
All the values for which the sources are not specified explicitly are taken from FDA’s Food Central. The exact link to the food presented on this page can be found below.
- Brazil nut - https://fdc.nal.usda.gov/fdc-app.html#/food-details/170569/nutrients
- Walnut - https://fdc.nal.usda.gov/fdc-app.html#/food-details/170187/nutrients
All the Daily Values are presented for males aged 31-50, for 2000-calorie diets.