Brazil nut nutrition: calories, carbs, GI, protein, fiber, fats
Nuts, brazilnuts, dried, unblanched
*all the values are displayed for the amount of 100 grams
Education:
Nutrition & Microbiology at YSU

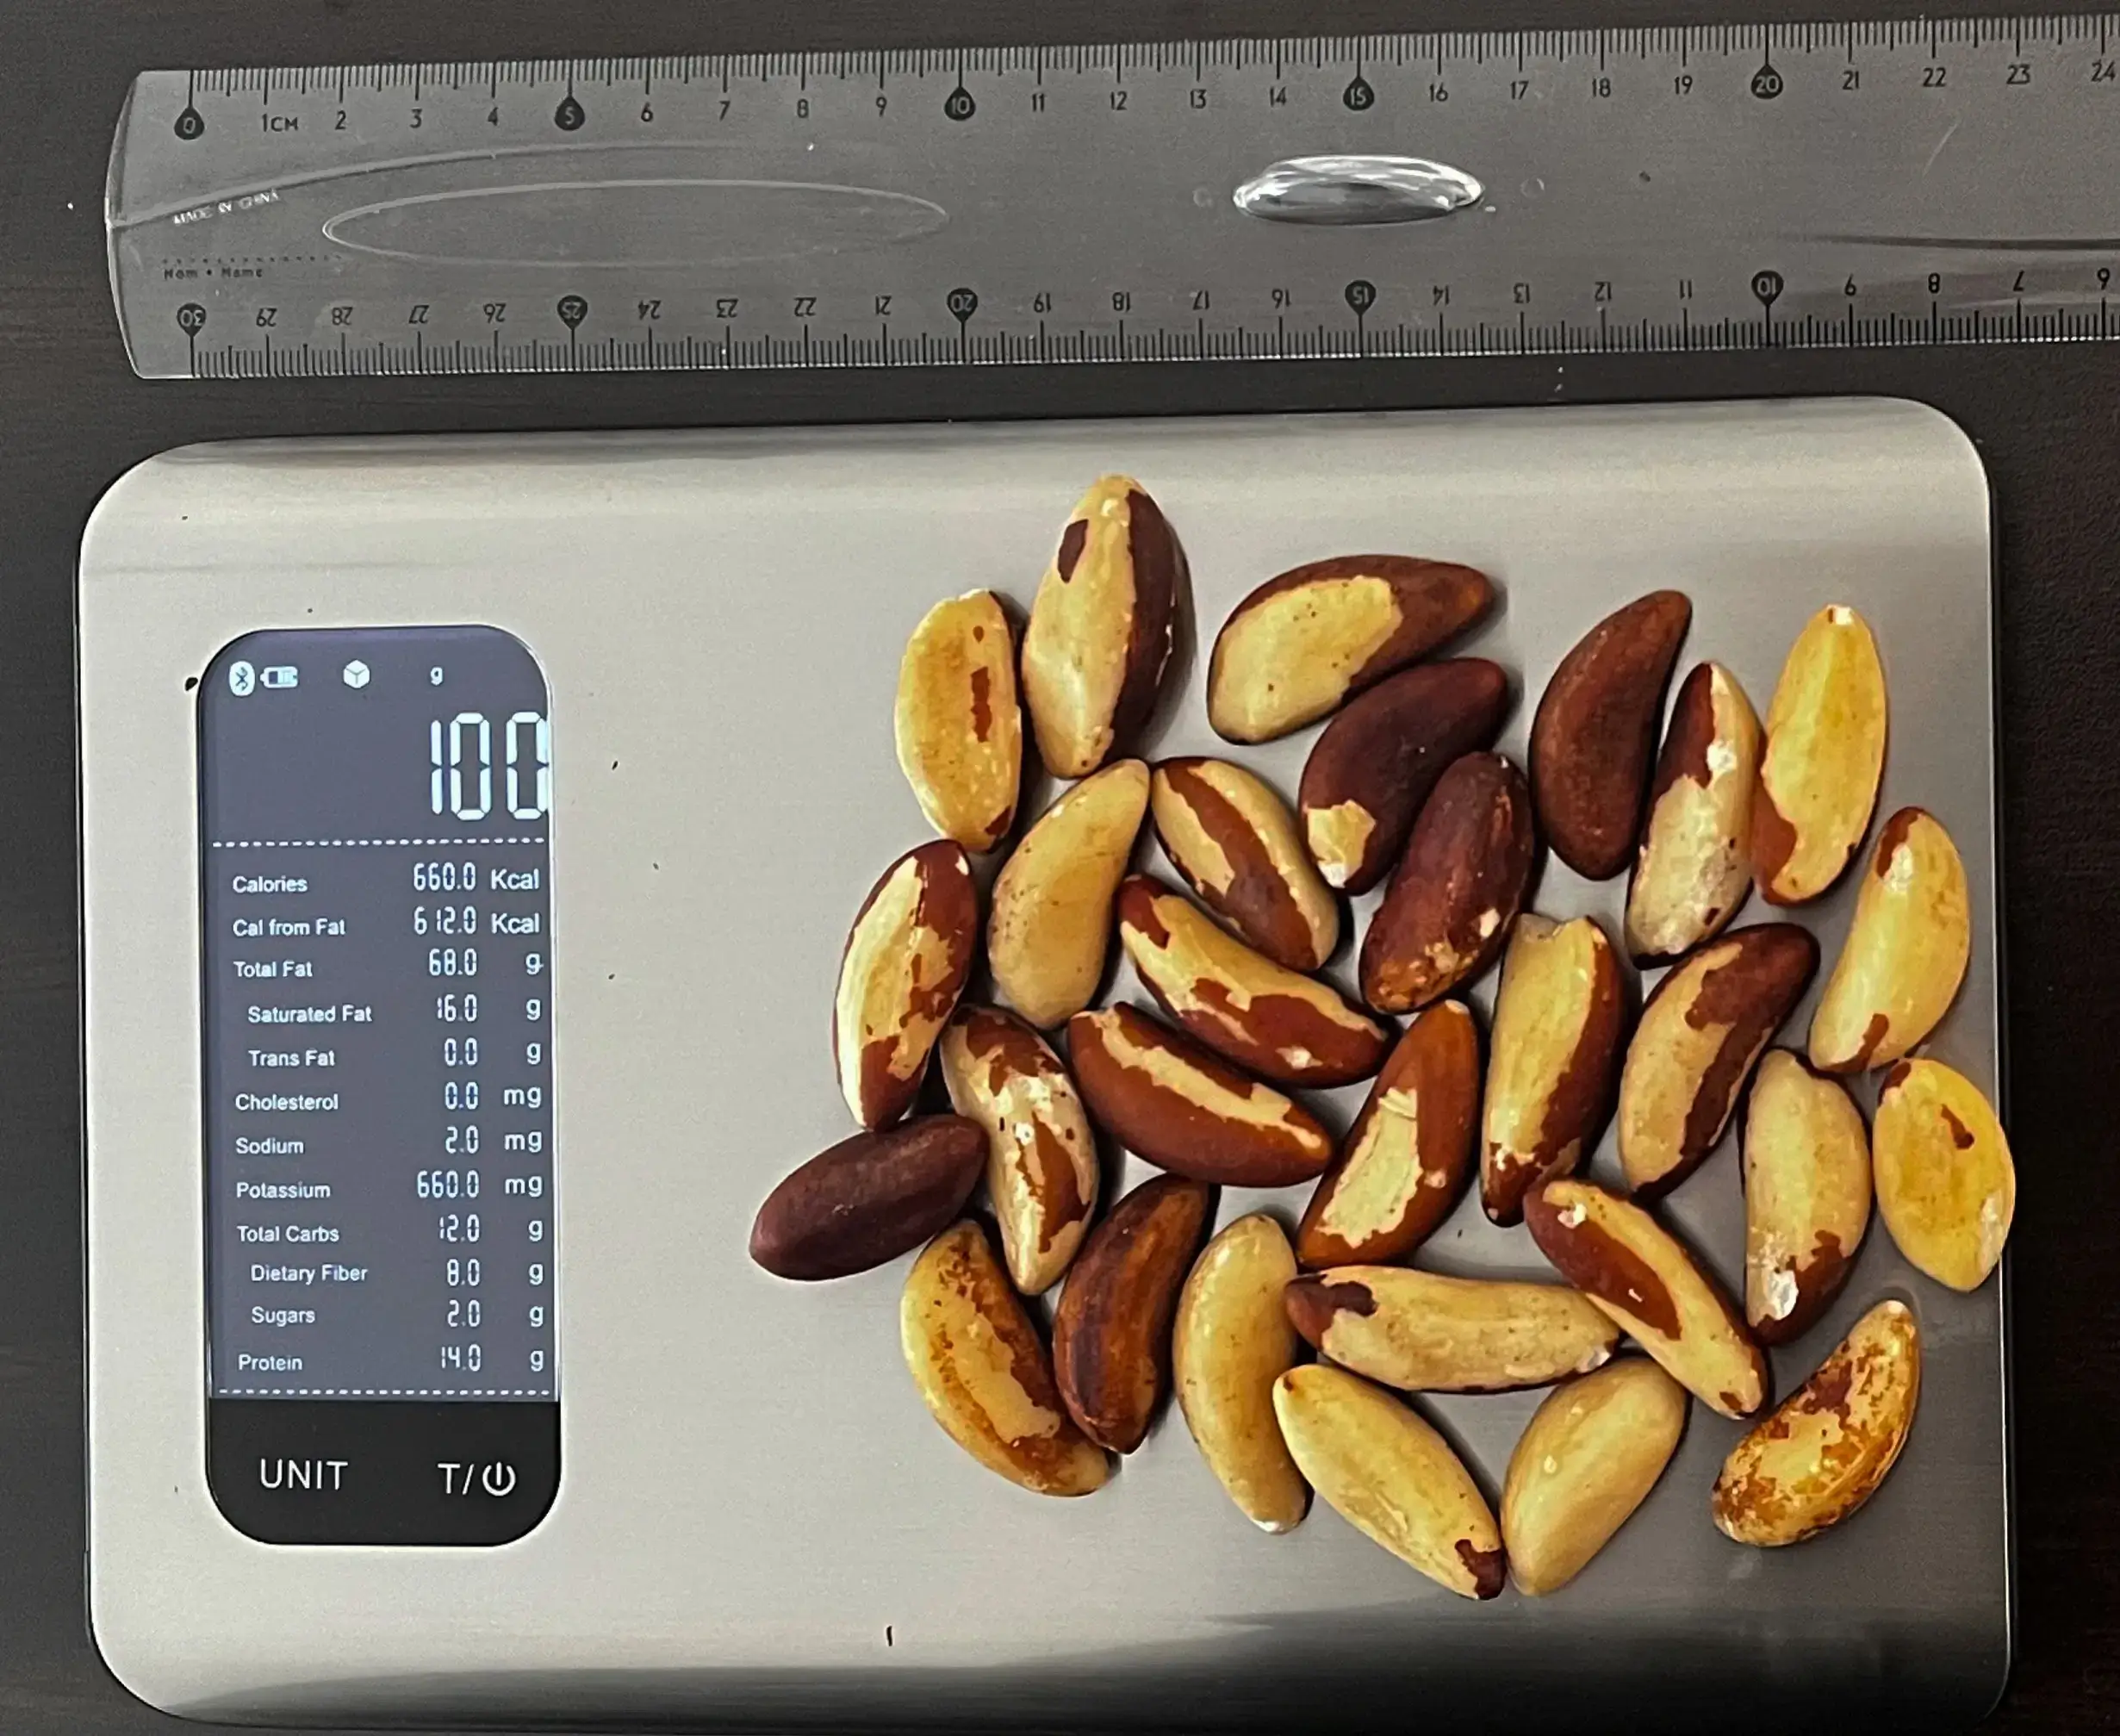
What Do 659 Calories or 100 Grams of Brazil Nuts Look Like?
Our team measured how 100 grams or 659 calories of Brazil nuts look. The picture above shows that 28 Brazil nuts comprise 100 grams or 659-660 calories.
This means each nut weighs about 3.6 grams or contains around 23 calories. The average serving size of Brazil nuts is 28.35 grams, providing 190 calories.
Remember that the calorie count can vary based on the weight, size, and whether you eat the nut raw or roasted.

Education: Nutrition & Microbiology at YSU
Last updated: December 19, 2023
Top nutrition facts for Brazil nut
| Calories ⓘ Calories for selected serving | 659 kcal |
| Glycemic index ⓘ Gi values are taken from various scientific sources. GI values less than 55 are considered as low. Values above 70 are considered as high. | 10 (low) |
| Glycemic load ⓘ Glycemic Load (GL) is a metric that measures both the quality (Glycemic Index) and quantity of carbohydrates in a specific serving of food to estimate its impact on blood sugar levels. It is calculated as: (GI × Carbs in grams) / 100. | 0 (low) |
| Net carbs ⓘ Net Carbs = Total Carbohydrates – Fiber – Sugar Alcohols | 4 g |
| Default serving size ⓘ Serving sizes are mostly taken from FDA's Reference Amounts Customarily Consumed (RACCs) | 1 oz (6 kernels) (28.35 g) |
| Acidity (Based on PRAL) ⓘ PRAL (Potential renal acid load) is calculated using a formula. On the PRAL scale the higher the positive value, the more is the acidifying effect on the body. The lower the negative value, the higher the alkalinity of the food. 0 is neutral. | 8.1 (acidic) |
Selenium ⓘHigher in Selenium content than 99% of foods
Magnesium ⓘHigher in Magnesium content than 99% of foods
Copper ⓘHigher in Copper content than 98% of foods
Phosphorus ⓘHigher in Phosphorus content than 98% of foods
Polyunsaturated fat ⓘHigher in Polyunsaturated fat content than 98% of foods
Brazil nut calories (kcal)
| Calories for different serving sizes of brazil nut | Calories | Weight |
|---|---|---|
| Calories in 100 grams | 659 | |
| Calories in 1 kernel | 33 | 5 g |
| Calories in 1 cup, whole | 876 | 133 g |
| Calories for different varieties of brazil nut | Calories | Weight |
|---|---|---|
| Nuts, brazilnuts, dried, unblanched (this food) | 659 | 100 g |
| Nuts, butternuts, dried | 612 | 100 g |
Extra Nutrition facts for Brazil nut
| Protein per 100 calories ⓘ Shows how many grams of protein you get from 100 calories of this food, calculated as (protein in g ÷ calories) × 100. | 2.2 g |
| Calories per 10 g protein ⓘ Shows how many calories you need to eat from this food to get 10 g of protein, calculated as (calories ÷ protein in g) × 10. | 460 kcal |
| Weight per 100 calories ⓘ Shows how many grams of this food equal 100 kcal—higher grams mean a larger portion for the same calories. | 15 g |
| Unsaturated / Saturated Fat ratio ⓘ (monounsaturated + polyunsaturated) / saturated, ≥2 broadly recommended by major guidelines for heart health | 3 |
Brazil nut Glycemic index (GI)
Gi values are taken from various scientific sources. GI values less than 55 are considered as low. Values above 70 are considered as high.
Mineral coverage chart
Mineral chart - relative view
Vitamin coverage chart
Vitamin A:
0µg of 900µg
0%
Vitamin E:
17mg of 15mg
113%
Vitamin D:
0µg of 20µg
0%
Vitamin C:
2.1mg of 90mg
2.3%
Vitamin B1:
1.9mg of 1mg
154%
Vitamin B2:
0.11mg of 1mg
8.1%
Vitamin B3:
0.89mg of 16mg
5.5%
Vitamin B5:
0.55mg of 5mg
11%
Vitamin B6:
0.3mg of 1mg
23%
Folate:
66µg of 400µg
17%
Vitamin B12:
0µg of 2µg
0%
Vitamin K:
0µg of 120µg
0%
Vitamin chart - relative view
Macronutrients chart
Protein:
Daily Value: 29%
14.3 g of 50 g
14.3 g (29% of DV )
Fats:
Daily Value: 103%
67.1 g of 65 g
67.1 g (103% of DV )
Carbs:
Daily Value: 4%
11.7 g of 300 g
11.7 g (4% of DV )
Water:
Daily Value: 0%
3.4 g of 2,000 g
3.4 g (0% of DV )
Other:
3.4 g
3.4 g
Protein quality breakdown
Tryptophan:
405mg of 280mg
145%
Threonine:
1095mg of 1,050mg
104%
Isoleucine:
1554mg of 1,400mg
111%
Leucine:
3570mg of 2,730mg
131%
Lysine:
1470mg of 2,100mg
70%
Methionine:
3372mg of 1,050mg
321%
Phenylalanine:
1917mg of 1,750mg
110%
Valine:
2280mg of 1,820mg
125%
Histidine:
1227mg of 700mg
175%
Fat type information
Saturated fat:
16 g
Monounsaturated fat:
24 g
Polyunsaturated fat:
24 g
Carbohydrate type breakdown
Starch:
0.25 g
Sucrose:
2.3 g
Glucose:
0 g
Fructose:
0 g
Lactose:
0 g
Maltose:
0 g
Galactose:
0 g
Fiber content ratio for Brazil nut
Sugar:
2.3 g
Fiber:
7.5 g
Other:
1.9 g
All nutrients for Brazil nut per 100g
| Nutrient | Value | DV% | In TOP % of foods | Comparison |
| Vitamin A | 0µg | 0% | 100% | |
| Calories | 659kcal | 33% | 2% |
14 times more than Orange
|
| Weight per 100 calories | 15g | N/A | 98% | |
| Protein per 100 calories | 2.2g | N/A | 70% | |
| Protein | 14g | 34% | 35% |
5.1 times more than Broccoli
|
| Calories per 10 g protein | 460kcal | N/A | 27% | |
| Unsaturated / Saturated Fat ratio | 3 | N/A | 27% | |
| Fats | 67g | 103% | 2% |
2 times more than Cheese
|
| Vitamin C | 0.7mg | 1% | 36% |
75.7 times less than Lemon
|
| Carbs | 12g | 4% | 46% |
2.4 times less than Rice
|
| Net carbs | 4.2g | N/A | 60% |
12.8 times less than Chocolate
|
| Cholesterol | 0mg | 0% | 100% |
N/A
|
| Vitamin D* | 0 IU | 0% | 100% |
N/A
|
| Vitamin D | 0µg | 0% | 100% |
N/A
|
| Magnesium | 376mg | 90% | 1% |
2.7 times more than Almonds
|
| Calcium | 160mg | 16% | 10% |
1.3 times more than Milk
|
| Potassium | 659mg | 19% | 5% |
4.5 times more than Cucumber
|
| Iron | 2.4mg | 30% | 28% |
1.1 times less than Beef broiled
|
| Sugar | 2.3g | N/A | 38% |
3.8 times less than Coca-Cola
|
| Fiber | 7.5g | 30% | 7% |
3.1 times more than Orange
|
| Copper | 1.7mg | 194% | 2% |
12.3 times more than Shiitake
|
| Zinc | 4.1mg | 37% | 16% |
1.6 times less than Beef broiled
|
| Starch | 0.25g | 0% | 11% |
61.2 times less than Potato
|
| Phosphorus | 725mg | 104% | 2% |
4 times more than Chicken meat
|
| Sodium | 3mg | 0% | 93% |
163.3 times less than White bread
|
| Vitamin E | 5.7mg | 38% | 4% |
3.9 times more than Kiwi
|
| Manganese | 1.2mg | 53% | 7% | |
| Selenium | 1917µg | 3485% | 1% | |
| Vitamin B1 | 0.62mg | 51% | 8% |
2.3 times more than Pea raw
|
| Vitamin B2 | 0.04mg | 3% | 79% |
3.7 times less than Avocado
|
| Vitamin B3 | 0.3mg | 2% | 77% |
32.5 times less than Turkey meat
|
| Vitamin B5 | 0.18mg | 4% | 57% |
6.1 times less than Sunflower seeds
|
| Vitamin B6 | 0.1mg | 8% | 54% |
1.2 times less than Oats
|
| Vitamin B12 | 0µg | 0% | 100% |
N/A
|
| Vitamin K | 0µg | 0% | 100% |
N/A
|
| Folate | 22µg | 6% | 33% |
2.8 times less than Brussels sprouts
|
| Saturated fat | 16g | 81% | 4% |
2.7 times more than Beef broiled
|
| Choline | 29mg | 5% | 26% | |
| Monounsaturated fat | 24g | N/A | 3% |
2.4 times more than Avocado
|
| Polyunsaturated fat | 24g | N/A | 2% |
1.9 times less than Walnut
|
| Tryptophan | 0.14mg | 0% | 32% |
2.3 times less than Chicken meat
|
| Threonine | 0.37mg | 0% | 35% |
2 times less than Beef broiled
|
| Isoleucine | 0.52mg | 0% | 33% |
1.8 times less than Salmon raw
|
| Leucine | 1.2mg | 0% | 30% |
2 times less than Tuna Bluefin
|
| Lysine | 0.49mg | 0% | 36% |
1.1 times more than Tofu
|
| Methionine | 1.1mg | 0% | 1% |
11.7 times more than Quinoa
|
| Phenylalanine | 0.64mg | 0% | 30% |
Equal to Egg
|
| Valine | 0.76mg | 0% | 29% |
2.7 times less than Soybean raw
|
| Histidine | 0.41mg | 0% | 30% |
1.8 times less than Turkey meat
|
| Fructose | 0g | 0% | 100% |
N/A
|
| Caffeine | 0mg | 0% | 100% | |
| Omega-3 - EPA | 0g | N/A | 100% |
N/A
|
| Omega-3 - DHA | 0g | N/A | 100% |
N/A
|
| Omega-3 - ALA | 0.02g | N/A | 17% |
507.8 times less than Canola oil
|
| Omega-3 - DPA | 0g | N/A | 100% |
N/A
|
| Omega-6 - Gamma-linoleic acid | 0.02g | N/A | 3% | |
| Omega-6 - Eicosadienoic acid | 0g | N/A | 100% | |
| Omega-6 - Linoleic acid | 24g | N/A | 1% |
1.9 times more than Almonds
|
Check out similar food or compare with current
NUTRITION FACTS LABEL
Nutrition Facts
___servings per container
Serving Size ______________
Serving Size ______________
Amount Per 100g
Calories 659
% Daily Value*
103%
Total Fat
67g
73%
Saturated Fat 16g
0
Trans Fat
0g
0
Cholesterol 0mg
0.13%
Sodium 3mg
3.9%
Total Carbohydrate
12g
30%
Dietary Fiber
7.5g
Total Sugars 0g
Includes ? g Added Sugars
Protein
14g
Vitamin D
0mcg
0
Calcium
160mg
16%
Iron
2.4mg
30%
Potassium
659mg
19%
*
The % Daily Value (DV) tells you how much a nutrient in a serving of food contributes to a daily diet. 2,000 calories a day is used for general nutrition advice.
Health checks
ⓘ
Dietary cholesterol is not associated with an increased risk of coronary heart disease in healthy individuals. However, dietary cholesterol is common in foods that are high in harmful saturated fats.
Source
Low in Cholesterol
ⓘ
Trans fat consumption increases the risk of cardiovascular disease and mortality by negatively affecting blood lipid levels.
Source
No Trans Fats
ⓘ
Saturated fat intake can raise total cholesterol and LDL (low-density lipoprotein) levels, leading to an increased risk of atherosclerosis. Dietary guidelines recommend limiting saturated fats to under 10% of calories a day.
Source
Low in Saturated Fats
ⓘ
While the consumption of moderate amounts of added sugars is not detrimental to health, an excessive intake can increase the risk of obesity, and therefore, diabetes.
Source
Low in Sugars
Brazil nut nutrition infographic
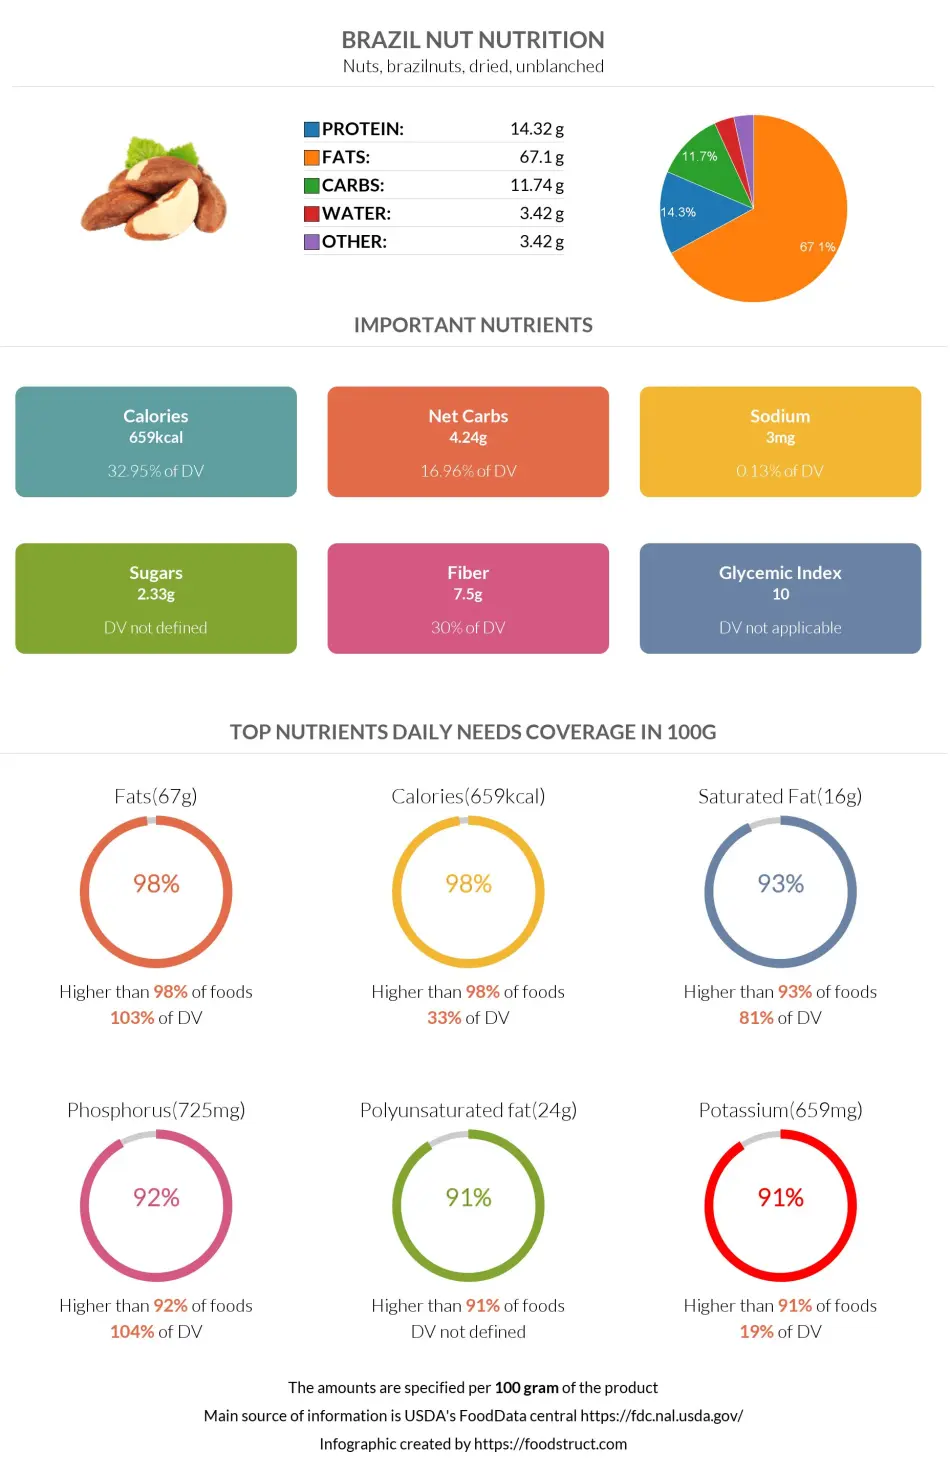
Infographic link
References
All the values for which the sources are not specified explicitly are taken from FDA’s Food Central. The exact link to the food presented on this page can be found below.