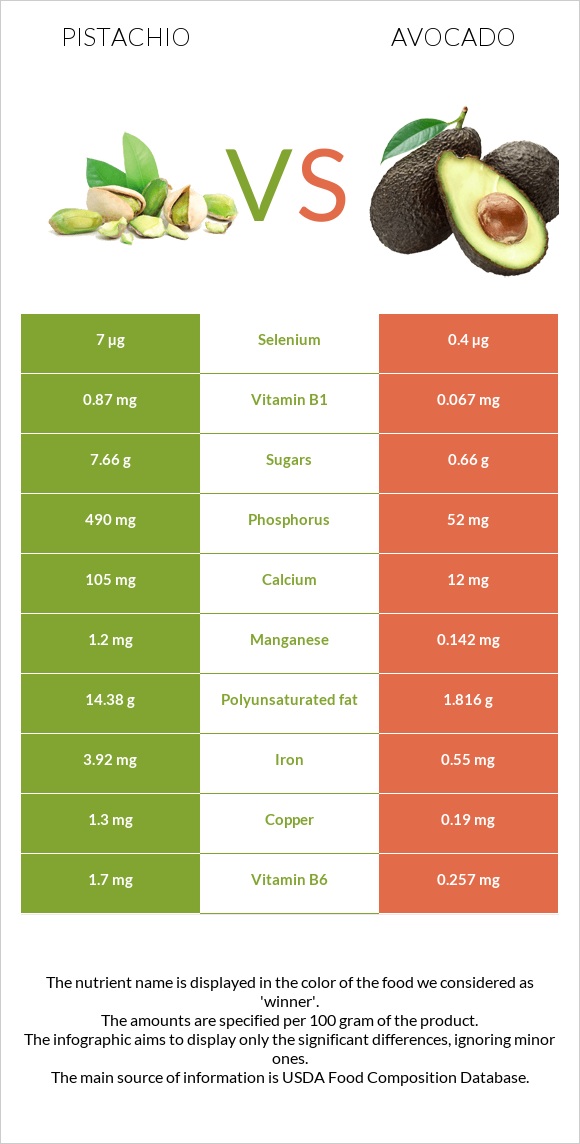
How are pistachios and avocados different? Pistachios are richer in copper, vitamin B6, vitamin B1, phosphorus, manganese, iron, magnesium, and potassium, while avocados are higher in vitamin B5. Pistachios cover your daily need for copper, 123% more than avocados. Pistachios contain 13 times more vitamin B1 than avocados. Pistachios contain 0.87mg of vitamin B1, while avocados contain 0.067mg. Avocados are lower in saturated fat. Avocados have a higher glycemic index (40) than pistachios (28). Nuts, pistachio nuts, raw and Avocados, raw, all commercial varieties types were used in this article.
Infographic
Mineral Comparison
Mineral comparison score is based on the number of minerals by which one or the other food is richer. The "coverage" charts below show how much of the daily needs can be covered by 300 grams of the food.
10
100 g
300 g
1 kernel - 0.7g 1 oz (49 kernels) - 28.35g 1 cup - 123g
Magnesium
Magnesium
Calcium
Calcium
Potassium
Potassium
Iron
Iron
Copper
Copper
Zinc
Zinc
Phosphorus
Phosphorus
Sodium
Sodium
Manganese
Manganese
Selenium
Selenium
86%
32%
90%
147%
433%
60%
210%
0.13%
157%
38%
0
100 g
300 g
1 cup, sliced - 146g 1 cup, cubes - 150g 1 avocado, NS as to Florida or California - 201g 1 cup, pureed - 230g
Magnesium
Magnesium
Calcium
Calcium
Potassium
Potassium
Iron
Iron
Copper
Copper
Zinc
Zinc
Phosphorus
Phosphorus
Sodium
Sodium
Manganese
Manganese
Selenium
Selenium
21%
3.6%
43%
21%
63%
17%
22%
0.91%
19%
2.2%
Vitamin Comparison
Vitamin comparison score is based on the number of vitamins by which one or the other food is richer. The "coverage" charts below show how much of the daily needs can be covered by 300 grams of the food.
5
100 g
300 g
1 kernel - 0.7g 1 oz (49 kernels) - 28.35g 1 cup - 123g
Vitamin C
Vit. C
Vitamin D
Vit. D
Vitamin A
Vit. A
Vitamin E
Vit. E
Vitamin B1
Vit. B1
Vitamin B2
Vit. B2
Vitamin B3
Vit. B3
Vitamin B5
Vit. B5
Vitamin B6
Vit. B6
Vitamin B12
Vit. B12
Vitamin K
Vit. K
Folate
Folate
19%
0%
8.7%
57%
218%
37%
24%
31%
392%
0%
0%
38%
5
100 g
300 g
1 cup, sliced - 146g 1 cup, cubes - 150g 1 avocado, NS as to Florida or California - 201g 1 cup, pureed - 230g
Vitamin C
Vit. C
Vitamin D
Vit. D
Vitamin A
Vit. A
Vitamin E
Vit. E
Vitamin B1
Vit. B1
Vitamin B2
Vit. B2
Vitamin B3
Vit. B3
Vitamin B5
Vit. B5
Vitamin B6
Vit. B6
Vitamin B12
Vit. B12
Vitamin K
Vit. K
Folate
Folate
33%
0%
2.3%
41%
17%
30%
33%
83%
59%
0%
53%
61%
All nutrients comparison - raw data values
Nutrient
DV% diff.
Copper
1.3mg
0.19mg
123%
Vitamin B6
1.7mg
0.257mg
111%
Polyunsaturated fat
14.38g
1.816g
84%
Vitamin B1
0.87mg
0.067mg
67%
Phosphorus
490mg
52mg
63%
Fats
45.32g
14.66g
47%
Manganese
1.2mg
0.142mg
46%
Iron
3.92mg
0.55mg
42%
Protein
20.16g
2g
36%
Monounsaturated fat
23.257g
9.799g
34%
Magnesium
121mg
29mg
22%
Calories
560kcal
160kcal
20%
Vitamin K
21µg
18%
Vitamin B5
0.52mg
1.389mg
17%
Saturated fat
5.907g
2.126g
17%
Potassium
1025mg
485mg
16%
Fiber
10.6g
6.7g
16%
Zinc
2.2mg
0.64mg
14%
Selenium
7µg
0.4µg
12%
Calcium
105mg
12mg
9%
Folate
51µg
81µg
8%
Carbs
27.17g
8.53g
6%
Vitamin C
5.6mg
10mg
5%
Vitamin E
2.86mg
2.07mg
5%
Vitamin B3
1.3mg
1.738mg
3%
Choline
14.2mg
3%
Vitamin A
26µg
7µg
2%
Vitamin B2
0.16mg
0.13mg
2%
Starch
1.67g
0.11g
1%
Protein per 100 calories
3.6g
1.3g
N/A
Calories per 10 g protein
278kcal
800kcal
N/A
Weight per 100 calories
18g
63g
N/A
Unsaturated / Saturated Fat ratio
6.4
5.5
N/A
Net carbs
16.57g
1.83g
N/A
Sugar
7.66g
0.66g
N/A
Sodium
1mg
7mg
0%
Tryptophan
0.251mg
0.025mg
0%
Threonine
0.684mg
0.073mg
0%
Isoleucine
0.917mg
0.084mg
0%
Leucine
1.604mg
0.143mg
0%
Lysine
1.138mg
0.132mg
0%
Methionine
0.36mg
0.038mg
0%
Phenylalanine
1.092mg
0.097mg
0%
Valine
1.249mg
0.107mg
0%
Histidine
0.512mg
0.049mg
0%
Fructose
0.24g
0.12g
0%
Omega-3 - ALA
0.111g
N/A
Omega-6 - Gamma-linoleic acid
0.015g
N/A
Omega-6 - Linoleic acid
14.091g
N/A
Macronutrient Comparison
Macronutrient breakdown side-by-side comparison
4
20%
45%
27%
4%
3%
Protein:
20.16 g
Fats:
45.32 g
Carbs:
27.17 g
Water:
4.37 g
Other:
2.98 g
1
2%
15%
9%
73%
Protein:
2 g
Fats:
14.66 g
Carbs:
8.53 g
Water:
73.23 g
Other:
1.58 g
Contains
more
Protein Protein
+908%
Contains
more
Fats Fats
+209.1%
Contains
more
Carbs Carbs
+218.5%
Contains
more
Other Other
+88.6%
Contains
more
Water Water
+1575.7%
Fat Type Comparison
Fat type breakdown side-by-side comparison
2
14%
53%
33%
Saturated fat:
Sat. Fat
5.907 g
Monounsaturated fat:
Mono. Fat
23.257 g
Polyunsaturated fat:
Poly. Fat
14.38 g
1
15%
71%
13%
Saturated fat:
Sat. Fat
2.126 g
Monounsaturated fat:
Mono. Fat
9.799 g
Polyunsaturated fat:
Poly. Fat
1.816 g
Contains
more
Mono. Fat Monounsaturated fat
+137.3%
Contains
more
Poly. Fat Polyunsaturated fat
+691.9%
Contains
less
Sat. Fat Saturated fat
-64%
Carbohydrate type comparison
Carbohydrate type breakdown side-by-side comparison
4
18%
74%
3%
3%
2%
Starch:
1.67 g
Sucrose:
6.87 g
Glucose:
0.32 g
Fructose:
0.24 g
Lactose:
0 g
Maltose:
0.17 g
Galactose:
0 g
2
14%
8%
49%
16%
13%
Starch:
0.11 g
Sucrose:
0.06 g
Glucose:
0.37 g
Fructose:
0.12 g
Lactose:
0 g
Maltose:
0 g
Galactose:
0.1 g
Contains
more
Starch Starch
+1418.2%
Contains
more
Sucrose Sucrose
+11350%
Contains
more
Fructose Fructose
+100%
Contains
more
Maltose Maltose
+∞%
Contains
more
Glucose Glucose
+15.6%
Contains
more
Galactose Galactose
+∞%