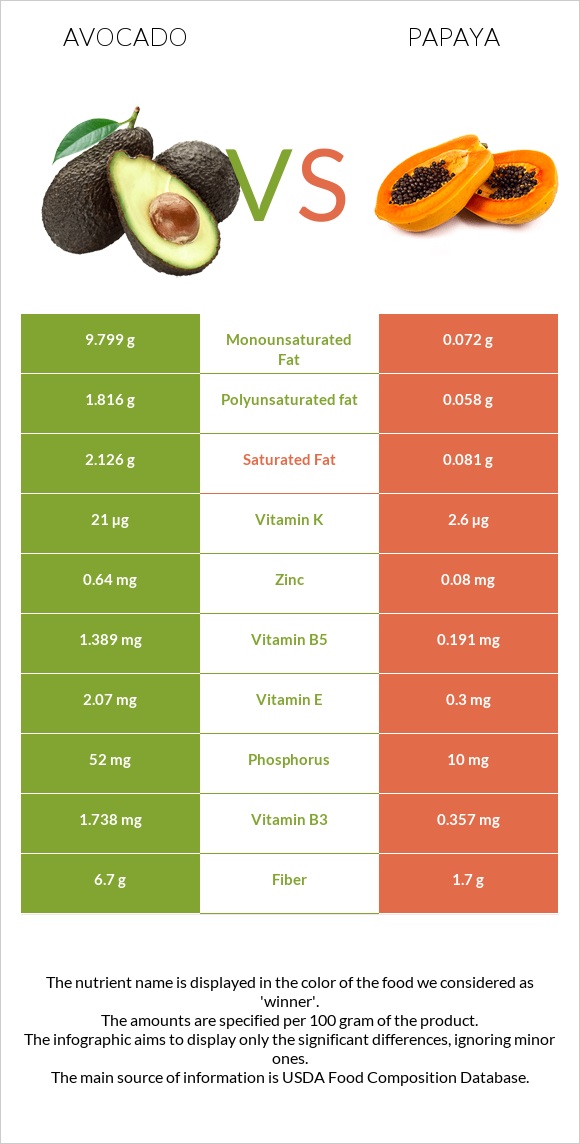
Summary of differences between avocados and papaya Avocados have more vitamin B5, fiber, vitamin B6, copper, vitamin K, vitamin E, and folate; however, papaya is higher in vitamin C and vitamin A. Papaya covers your daily need for vitamin C, 57% more than avocados. Avocados have 26 times more saturated fat than papaya. While avocados have 2.126g of saturated fat, papaya has only 0.081g. These are the specific foods used in this comparison Avocados, raw, all commercial varieties and Papayas, raw .
Infographic
Mineral Comparison
Mineral comparison score is based on the number of minerals by which one or the other food is richer. The "coverage" charts below show how much of the daily needs can be covered by 300 grams of the food.
8
100 g
300 g
1 cup, sliced - 146g 1 cup, cubes - 150g 1 avocado, NS as to Florida or California - 201g 1 cup, pureed - 230g
Magnesium
Magnesium
Calcium
Calcium
Potassium
Potassium
Iron
Iron
Copper
Copper
Zinc
Zinc
Phosphorus
Phosphorus
Sodium
Sodium
Manganese
Manganese
Selenium
Selenium
21%
3.6%
43%
21%
63%
17%
22%
0.91%
19%
2.2%
2
100 g
300 g
1 cup 1" pieces - 145g 1 fruit, small - 157g 1 cup, mashed - 230g 1 fruit, large - 781g
Magnesium
Magnesium
Calcium
Calcium
Potassium
Potassium
Iron
Iron
Copper
Copper
Zinc
Zinc
Phosphorus
Phosphorus
Sodium
Sodium
Manganese
Manganese
Selenium
Selenium
15%
6%
16%
9.4%
15%
2.2%
4.3%
1%
5.2%
3.3%
Vitamin Comparison
Vitamin comparison score is based on the number of vitamins by which one or the other food is richer. The "coverage" charts below show how much of the daily needs can be covered by 300 grams of the food.
8
100 g
300 g
1 cup, sliced - 146g 1 cup, cubes - 150g 1 avocado, NS as to Florida or California - 201g 1 cup, pureed - 230g
Vitamin C
Vit. C
Vitamin D
Vit. D
Vitamin A
Vit. A
Vitamin E
Vit. E
Vitamin B1
Vit. B1
Vitamin B2
Vit. B2
Vitamin B3
Vit. B3
Vitamin B5
Vit. B5
Vitamin B6
Vit. B6
Vitamin B12
Vit. B12
Vitamin K
Vit. K
Folate
Folate
33%
0%
2.3%
41%
17%
30%
33%
83%
59%
0%
53%
61%
2
100 g
300 g
1 cup 1" pieces - 145g 1 fruit, small - 157g 1 cup, mashed - 230g 1 fruit, large - 781g
Vitamin C
Vit. C
Vitamin D
Vit. D
Vitamin A
Vit. A
Vitamin E
Vit. E
Vitamin B1
Vit. B1
Vitamin B2
Vit. B2
Vitamin B3
Vit. B3
Vitamin B5
Vit. B5
Vitamin B6
Vit. B6
Vitamin B12
Vit. B12
Vitamin K
Vit. K
Folate
Folate
203%
0%
16%
6%
5.8%
6.2%
6.7%
11%
8.8%
0%
6.5%
28%
All nutrients comparison - raw data values
Nutrient
DV% diff.
Vitamin C
10mg
60.9mg
57%
Vitamin B5
1.389mg
0.191mg
24%
Monounsaturated fat
9.799g
0.072g
24%
Fats
14.66g
0.26g
22%
Fiber
6.7g
1.7g
20%
Vitamin B6
0.257mg
0.038mg
17%
Copper
0.19mg
0.045mg
16%
Vitamin K
21µg
2.6µg
15%
Vitamin E
2.07mg
0.3mg
12%
Polyunsaturated fat
1.816g
0.058g
12%
Folate
81µg
37µg
11%
Potassium
485mg
182mg
9%
Vitamin B3
1.738mg
0.357mg
9%
Saturated fat
2.126g
0.081g
9%
Vitamin B2
0.13mg
0.027mg
8%
Calories
160kcal
43kcal
6%
Phosphorus
52mg
10mg
6%
Zinc
0.64mg
0.08mg
5%
Fructose
0.12g
3.73g
5%
Iron
0.55mg
0.25mg
4%
Vitamin A
7µg
47µg
4%
Manganese
0.142mg
0.04mg
4%
Vitamin B1
0.067mg
0.023mg
4%
Protein
2g
0.47g
3%
Magnesium
29mg
21mg
2%
Carbs
8.53g
10.82g
1%
Calcium
12mg
20mg
1%
Choline
14.2mg
6.1mg
1%
Protein per 100 calories
1.3g
1.1g
N/A
Calories per 10 g protein
800kcal
915kcal
N/A
Weight per 100 calories
63g
233g
N/A
Unsaturated / Saturated Fat ratio
5.5
1.6
N/A
Net carbs
1.83g
9.12g
N/A
Sugar
0.66g
7.82g
N/A
Starch
0.11g
0g
0%
Sodium
7mg
8mg
0%
Selenium
0.4µg
0.6µg
0%
Tryptophan
0.025mg
0.008mg
0%
Threonine
0.073mg
0.011mg
0%
Isoleucine
0.084mg
0.008mg
0%
Leucine
0.143mg
0.016mg
0%
Lysine
0.132mg
0.025mg
0%
Methionine
0.038mg
0.002mg
0%
Phenylalanine
0.097mg
0.009mg
0%
Valine
0.107mg
0.01mg
0%
Histidine
0.049mg
0.005mg
0%
Omega-3 - ALA
0.111g
N/A
Omega-6 - Gamma-linoleic acid
0.015g
N/A
Macronutrient Comparison
Macronutrient breakdown side-by-side comparison
3
2%
15%
9%
73%
Protein:
2 g
Fats:
14.66 g
Carbs:
8.53 g
Water:
73.23 g
Other:
1.58 g
2
11%
88%
Protein:
0.47 g
Fats:
0.26 g
Carbs:
10.82 g
Water:
88.06 g
Other:
0.39 g
Contains
more
Protein Protein
+325.5%
Contains
more
Fats Fats
+5538.5%
Contains
more
Other Other
+305.1%
Contains
more
Carbs Carbs
+26.8%
Contains
more
Water Water
+20.3%
Fat Type Comparison
Fat type breakdown side-by-side comparison
2
15%
71%
13%
Saturated fat:
Sat. Fat
2.126 g
Monounsaturated fat:
Mono. Fat
9.799 g
Polyunsaturated fat:
Poly. Fat
1.816 g
1
38%
34%
27%
Saturated fat:
Sat. Fat
0.081 g
Monounsaturated fat:
Mono. Fat
0.072 g
Polyunsaturated fat:
Poly. Fat
0.058 g
Contains
more
Mono. Fat Monounsaturated fat
+13509.7%
Contains
more
Poly. Fat Polyunsaturated fat
+3031%
Contains
less
Sat. Fat Saturated fat
-96.2%
Carbohydrate type comparison
Carbohydrate type breakdown side-by-side comparison
3
14%
8%
49%
16%
13%
Starch:
0.11 g
Sucrose:
0.06 g
Glucose:
0.37 g
Fructose:
0.12 g
Lactose:
0 g
Maltose:
0 g
Galactose:
0.1 g
2
52%
48%
Starch:
0 g
Sucrose:
0 g
Glucose:
4.09 g
Fructose:
3.73 g
Lactose:
0 g
Maltose:
0 g
Galactose:
0 g
Contains
more
Starch Starch
+∞%
Contains
more
Sucrose Sucrose
+∞%
Contains
more
Galactose Galactose
+∞%
Contains
more
Glucose Glucose
+1005.4%
Contains
more
Fructose Fructose
+3008.3%
~equal in
Lactose
~0g
~equal in
Maltose
~0g