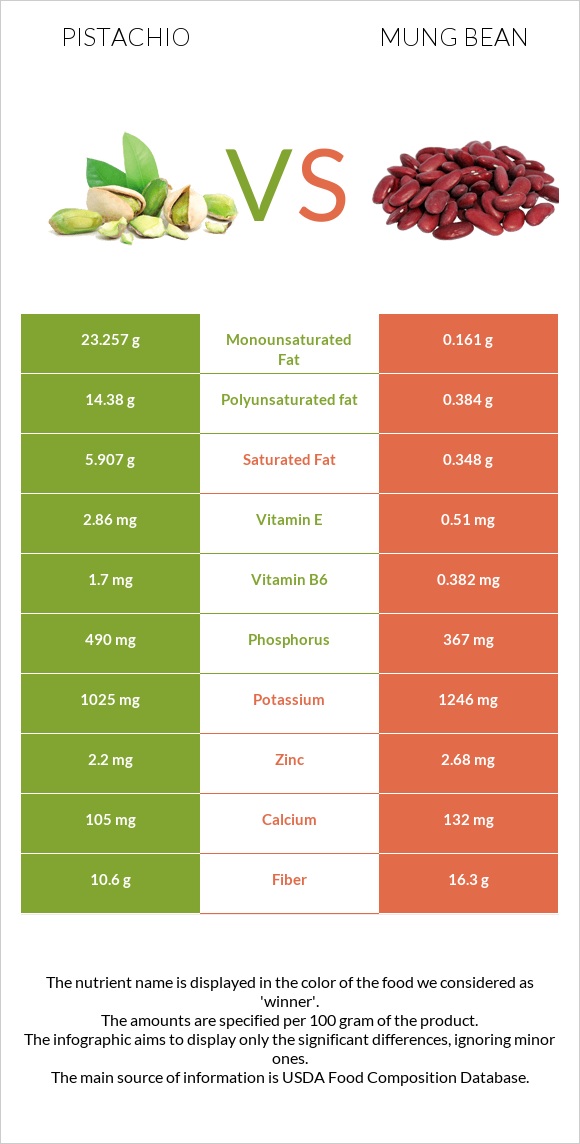
Differences between pistachios and mung beans Pistachios are higher in vitamin B6, copper, vitamin B1, and phosphorus; however, mung beans are richer in folate, iron, vitamin B5, fiber, and magnesium. Mung beans' daily need coverage for folate is 144% higher. Pistachios have 17 times more saturated fat than mung beans. While pistachios have 5.907g of saturated fat, mung beans have only 0.348g. The food types used in this comparison are Nuts, pistachio nuts, raw and Mung beans, mature seeds, raw .
Infographic
Mineral Comparison
Mineral comparison score is based on the number of minerals by which one or the other food is richer. The "coverage" charts below show how much of the daily needs can be covered by 300 grams of the food.
4
100 g
300 g
1 kernel - 0.7g 1 oz (49 kernels) - 28.35g 1 cup - 123g
Magnesium
Magnesium
Calcium
Calcium
Potassium
Potassium
Iron
Iron
Copper
Copper
Zinc
Zinc
Phosphorus
Phosphorus
Sodium
Sodium
Manganese
Manganese
Selenium
Selenium
86%
32%
90%
147%
433%
60%
210%
0.13%
157%
38%
6
100 g
300 g
1 tbsp - 13g 1 cup - 207g
Magnesium
Magnesium
Calcium
Calcium
Potassium
Potassium
Iron
Iron
Copper
Copper
Zinc
Zinc
Phosphorus
Phosphorus
Sodium
Sodium
Manganese
Manganese
Selenium
Selenium
135%
40%
110%
253%
314%
73%
157%
2%
135%
45%
Vitamin Comparison
Vitamin comparison score is based on the number of vitamins by which one or the other food is richer. The "coverage" charts below show how much of the daily needs can be covered by 300 grams of the food.
5
100 g
300 g
1 kernel - 0.7g 1 oz (49 kernels) - 28.35g 1 cup - 123g
Vitamin C
Vit. C
Vitamin D
Vit. D
Vitamin A
Vit. A
Vitamin E
Vit. E
Vitamin B1
Vit. B1
Vitamin B2
Vit. B2
Vitamin B3
Vit. B3
Vitamin B5
Vit. B5
Vitamin B6
Vit. B6
Vitamin B12
Vit. B12
Vitamin K
Vit. K
Folate
Folate
19%
0%
8.7%
57%
218%
37%
24%
31%
392%
0%
0%
38%
5
100 g
300 g
1 tbsp - 13g 1 cup - 207g
Vitamin C
Vit. C
Vitamin D
Vit. D
Vitamin A
Vit. A
Vitamin E
Vit. E
Vitamin B1
Vit. B1
Vitamin B2
Vit. B2
Vitamin B3
Vit. B3
Vitamin B5
Vit. B5
Vitamin B6
Vit. B6
Vitamin B12
Vit. B12
Vitamin K
Vit. K
Folate
Folate
16%
0%
2%
10%
155%
54%
42%
115%
88%
0%
23%
469%
All nutrients comparison - raw data values
Nutrient
DV% diff.
Folate
51µg
625µg
144%
Vitamin B6
1.7mg
0.382mg
101%
Polyunsaturated fat
14.38g
0.384g
93%
Fats
45.32g
1.15g
68%
Monounsaturated fat
23.257g
0.161g
58%
Copper
1.3mg
0.941mg
40%
Iron
3.92mg
6.74mg
35%
Vitamin B5
0.52mg
1.91mg
28%
Saturated fat
5.907g
0.348g
25%
Fiber
10.6g
16.3g
23%
Vitamin B1
0.87mg
0.621mg
21%
Phosphorus
490mg
367mg
18%
Choline
97.9mg
18%
Magnesium
121mg
189mg
16%
Vitamin E
2.86mg
0.51mg
16%
Carbs
27.17g
62.62g
12%
Calories
560kcal
347kcal
11%
Vitamin K
9µg
8%
Protein
20.16g
23.86g
7%
Potassium
1025mg
1246mg
7%
Manganese
1.2mg
1.035mg
7%
Vitamin B2
0.16mg
0.233mg
6%
Vitamin B3
1.3mg
2.251mg
6%
Zinc
2.2mg
2.68mg
4%
Calcium
105mg
132mg
3%
Vitamin A
26µg
6µg
2%
Selenium
7µg
8.2µg
2%
Vitamin C
5.6mg
4.8mg
1%
Starch
1.67g
1%
Sodium
1mg
15mg
1%
Protein per 100 calories
3.6g
6.9g
N/A
Calories per 10 g protein
278kcal
145kcal
N/A
Weight per 100 calories
18g
29g
N/A
Unsaturated / Saturated Fat ratio
6.4
1.6
N/A
Net carbs
16.57g
46.32g
N/A
Sugar
7.66g
6.6g
N/A
Tryptophan
0.251mg
0.26mg
0%
Threonine
0.684mg
0.782mg
0%
Isoleucine
0.917mg
1.008mg
0%
Leucine
1.604mg
1.847mg
0%
Lysine
1.138mg
1.664mg
0%
Methionine
0.36mg
0.286mg
0%
Phenylalanine
1.092mg
1.443mg
0%
Valine
1.249mg
1.237mg
0%
Histidine
0.512mg
0.695mg
0%
Fructose
0.24g
0%
Omega-6 - Linoleic acid
14.091g
N/A
Macronutrient Comparison
Macronutrient breakdown side-by-side comparison
1
20%
45%
27%
4%
3%
Protein:
20.16 g
Fats:
45.32 g
Carbs:
27.17 g
Water:
4.37 g
Other:
2.98 g
4
24%
63%
9%
3%
Protein:
23.86 g
Fats:
1.15 g
Carbs:
62.62 g
Water:
9.05 g
Other:
3.32 g
Contains
more
Fats Fats
+3840.9%
Contains
more
Protein Protein
+18.4%
Contains
more
Carbs Carbs
+130.5%
Contains
more
Water Water
+107.1%
Contains
more
Other Other
+11.4%
Fat Type Comparison
Fat type breakdown side-by-side comparison
2
14%
53%
33%
Saturated fat:
Sat. Fat
5.907 g
Monounsaturated fat:
Mono. Fat
23.257 g
Polyunsaturated fat:
Poly. Fat
14.38 g
1
39%
18%
43%
Saturated fat:
Sat. Fat
0.348 g
Monounsaturated fat:
Mono. Fat
0.161 g
Polyunsaturated fat:
Poly. Fat
0.384 g
Contains
more
Mono. Fat Monounsaturated fat
+14345.3%
Contains
more
Poly. Fat Polyunsaturated fat
+3644.8%
Contains
less
Sat. Fat Saturated fat
-94.1%