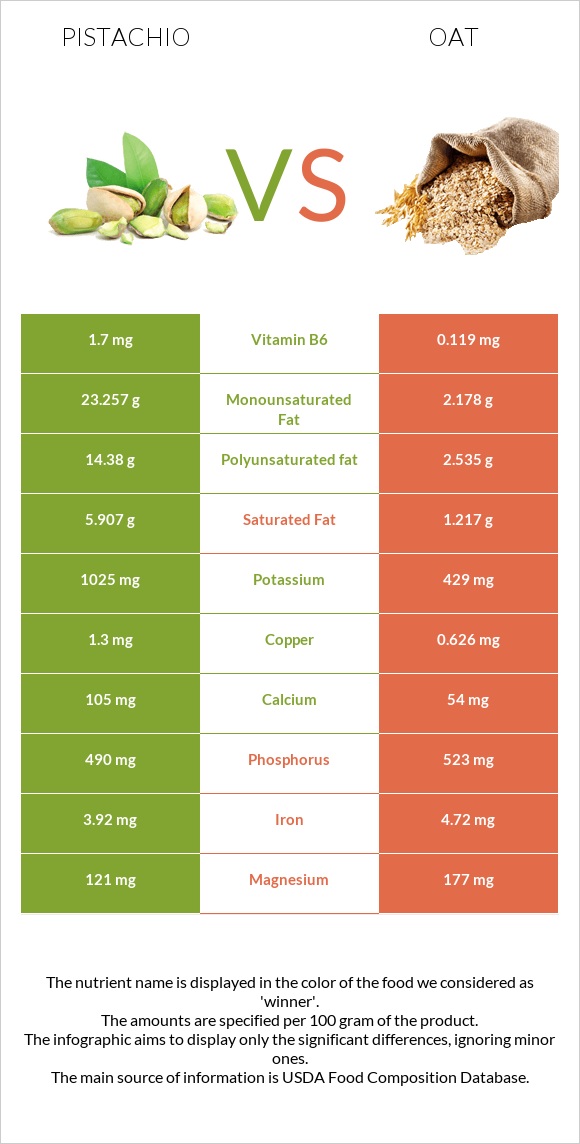
How are pistachios and oats different? Pistachios are higher in vitamin B6, copper, potassium, and vitamin A; however, oats are richer in manganese, vitamin B5, zinc, magnesium, and iron. Daily need coverage for manganese for oats is 162% higher. Oats have less saturated fat. Pistachios have a lower glycemic index (28) than oats (59). Nuts, pistachio nuts, raw and Oats are the varieties used in this article.
Infographic
Mineral Comparison
Mineral comparison score is based on the number of minerals by which one or the other food is richer. The "coverage" charts below show how much of the daily needs can be covered by 300 grams of the food.
5
100 g
300 g
1 kernel - 0.7g 1 oz (49 kernels) - 28.35g 1 cup - 123g
Magnesium
Magnesium
Calcium
Calcium
Potassium
Potassium
Iron
Iron
Copper
Copper
Zinc
Zinc
Phosphorus
Phosphorus
Sodium
Sodium
Manganese
Manganese
Selenium
Selenium
86%
32%
90%
147%
433%
60%
210%
0.13%
157%
38%
4
100 g
300 g
1 cup - 156g
Magnesium
Magnesium
Calcium
Calcium
Potassium
Potassium
Iron
Iron
Copper
Copper
Zinc
Zinc
Phosphorus
Phosphorus
Sodium
Sodium
Manganese
Manganese
Selenium
Selenium
126%
16%
38%
177%
209%
108%
224%
0.26%
641%
0%
Vitamin Comparison
Vitamin comparison score is based on the number of vitamins by which one or the other food is richer. The "coverage" charts below show how much of the daily needs can be covered by 300 grams of the food.
7
100 g
300 g
1 kernel - 0.7g 1 oz (49 kernels) - 28.35g 1 cup - 123g
Vitamin C
Vit. C
Vitamin D
Vit. D
Vitamin A
Vit. A
Vitamin E
Vit. E
Vitamin B1
Vit. B1
Vitamin B2
Vit. B2
Vitamin B3
Vit. B3
Vitamin B5
Vit. B5
Vitamin B6
Vit. B6
Vitamin B12
Vit. B12
Vitamin K
Vit. K
Folate
Folate
19%
0%
8.7%
57%
218%
37%
24%
31%
392%
0%
0%
38%
1
100 g
300 g
1 cup - 156g
Vitamin C
Vit. C
Vitamin D
Vit. D
Vitamin A
Vit. A
Vitamin E
Vit. E
Vitamin B1
Vit. B1
Vitamin B2
Vit. B2
Vitamin B3
Vit. B3
Vitamin B5
Vit. B5
Vitamin B6
Vit. B6
Vitamin B12
Vit. B12
Vitamin K
Vit. K
Folate
Folate
0%
0%
0%
0%
191%
32%
18%
81%
27%
0%
0%
42%
All nutrients comparison - raw data values
Nutrient
DV% diff.
Manganese
1.2mg
4.916mg
162%
Vitamin B6
1.7mg
0.119mg
122%
Polyunsaturated fat
14.38g
2.535g
79%
Copper
1.3mg
0.626mg
75%
Fats
45.32g
6.9g
59%
Monounsaturated fat
23.257g
2.178g
53%
Saturated fat
5.907g
1.217g
21%
Vitamin E
2.86mg
19%
Potassium
1025mg
429mg
18%
Vitamin B5
0.52mg
1.349mg
17%
Zinc
2.2mg
3.97mg
16%
Carbs
27.17g
66.27g
13%
Magnesium
121mg
177mg
13%
Selenium
7µg
13%
Iron
3.92mg
4.72mg
10%
Calories
560kcal
389kcal
9%
Vitamin B1
0.87mg
0.763mg
9%
Protein
20.16g
16.89g
7%
Vitamin C
5.6mg
0mg
6%
Calcium
105mg
54mg
5%
Phosphorus
490mg
523mg
5%
Vitamin A
26µg
0µg
3%
Vitamin B2
0.16mg
0.139mg
2%
Vitamin B3
1.3mg
0.961mg
2%
Starch
1.67g
1%
Folate
51µg
56µg
1%
Protein per 100 calories
3.6g
4.3g
N/A
Calories per 10 g protein
278kcal
230kcal
N/A
Weight per 100 calories
18g
26g
N/A
Unsaturated / Saturated Fat ratio
6.4
3.9
N/A
Net carbs
16.57g
55.67g
N/A
Sugar
7.66g
N/A
Fiber
10.6g
10.6g
0%
Sodium
1mg
2mg
0%
Tryptophan
0.251mg
0.234mg
0%
Threonine
0.684mg
0.575mg
0%
Isoleucine
0.917mg
0.694mg
0%
Leucine
1.604mg
1.284mg
0%
Lysine
1.138mg
0.701mg
0%
Methionine
0.36mg
0.312mg
0%
Phenylalanine
1.092mg
0.895mg
0%
Valine
1.249mg
0.937mg
0%
Histidine
0.512mg
0.405mg
0%
Fructose
0.24g
0%
Omega-6 - Linoleic acid
14.091g
N/A
Macronutrient Comparison
Macronutrient breakdown side-by-side comparison
3
20%
45%
27%
4%
3%
Protein:
20.16 g
Fats:
45.32 g
Carbs:
27.17 g
Water:
4.37 g
Other:
2.98 g
2
17%
7%
66%
8%
2%
Protein:
16.89 g
Fats:
6.9 g
Carbs:
66.27 g
Water:
8.22 g
Other:
1.72 g
Contains
more
Protein Protein
+19.4%
Contains
more
Fats Fats
+556.8%
Contains
more
Other Other
+73.3%
Contains
more
Carbs Carbs
+143.9%
Contains
more
Water Water
+88.1%
Fat Type Comparison
Fat type breakdown side-by-side comparison
2
14%
53%
33%
Saturated fat:
Sat. Fat
5.907 g
Monounsaturated fat:
Mono. Fat
23.257 g
Polyunsaturated fat:
Poly. Fat
14.38 g
1
21%
37%
43%
Saturated fat:
Sat. Fat
1.217 g
Monounsaturated fat:
Mono. Fat
2.178 g
Polyunsaturated fat:
Poly. Fat
2.535 g
Contains
more
Mono. Fat Monounsaturated fat
+967.8%
Contains
more
Poly. Fat Polyunsaturated fat
+467.3%
Contains
less
Sat. Fat Saturated fat
-79.4%