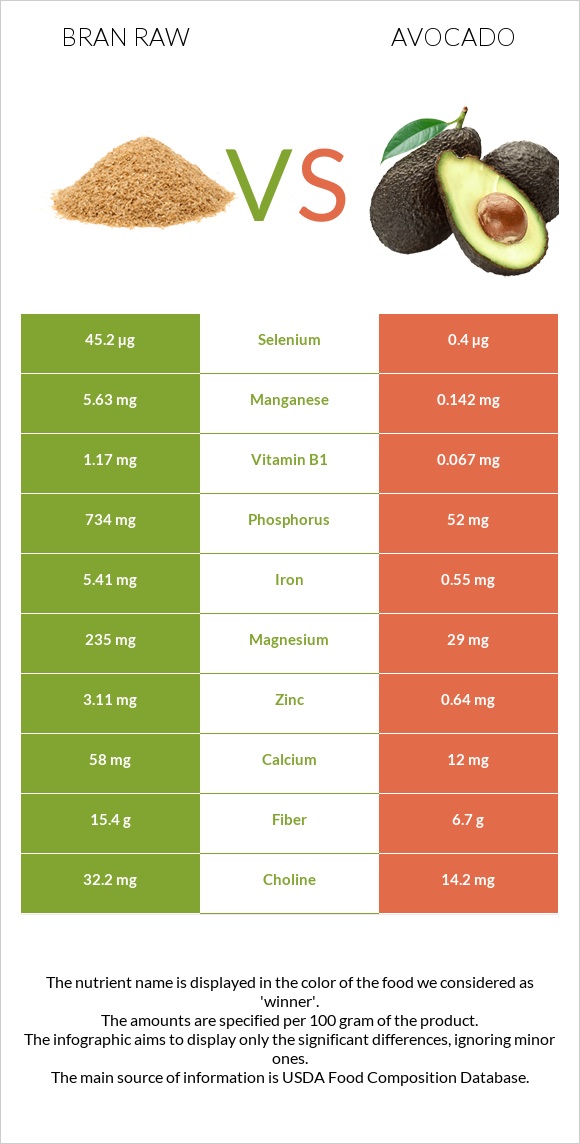
Significant differences between bran raw and avocados Bran raw has more manganese, phosphorus, vitamin B1, selenium, iron, magnesium, fiber, copper, and zinc; however, avocados are richer in vitamin K. Bran raw covers your daily manganese needs 239% more than avocados. Avocados have 113 times less selenium than bran raw. Bran raw has 45.2µg of selenium, while avocados have 0.4µg. Bran raw has a higher glycemic index. The glycemic index of bran raw is 56, while the glycemic index of avocados is 40. Specific food types used in this comparison are Oat bran, raw and Avocados, raw, all commercial varieties .
Infographic
Mineral Comparison
Mineral comparison score is based on the number of minerals by which one or the other food is richer. The "coverage" charts below show how much of the daily needs can be covered by 300 grams of the food.
10
100 g
300 g
1 cup - 94g
Magnesium
Magnesium
Calcium
Calcium
Potassium
Potassium
Iron
Iron
Copper
Copper
Zinc
Zinc
Phosphorus
Phosphorus
Sodium
Sodium
Manganese
Manganese
Selenium
Selenium
168%
17%
50%
203%
134%
85%
315%
0.52%
734%
247%
0
100 g
300 g
1 cup, sliced - 146g 1 cup, cubes - 150g 1 avocado, NS as to Florida or California - 201g 1 cup, pureed - 230g
Magnesium
Magnesium
Calcium
Calcium
Potassium
Potassium
Iron
Iron
Copper
Copper
Zinc
Zinc
Phosphorus
Phosphorus
Sodium
Sodium
Manganese
Manganese
Selenium
Selenium
21%
3.6%
43%
21%
63%
17%
22%
0.91%
19%
2.2%
Vitamin Comparison
Vitamin comparison score is based on the number of vitamins by which one or the other food is richer. The "coverage" charts below show how much of the daily needs can be covered by 300 grams of the food.
2
100 g
300 g
1 cup - 94g
Vitamin C
Vit. C
Vitamin D
Vit. D
Vitamin A
Vit. A
Vitamin E
Vit. E
Vitamin B1
Vit. B1
Vitamin B2
Vit. B2
Vitamin B3
Vit. B3
Vitamin B5
Vit. B5
Vitamin B6
Vit. B6
Vitamin B12
Vit. B12
Vitamin K
Vit. K
Folate
Folate
0%
0%
0%
20%
293%
51%
18%
90%
38%
0%
8%
39%
7
100 g
300 g
1 cup, sliced - 146g 1 cup, cubes - 150g 1 avocado, NS as to Florida or California - 201g 1 cup, pureed - 230g
Vitamin C
Vit. C
Vitamin D
Vit. D
Vitamin A
Vit. A
Vitamin E
Vit. E
Vitamin B1
Vit. B1
Vitamin B2
Vit. B2
Vitamin B3
Vit. B3
Vitamin B5
Vit. B5
Vitamin B6
Vit. B6
Vitamin B12
Vit. B12
Vitamin K
Vit. K
Folate
Folate
33%
0%
2.3%
41%
17%
30%
33%
83%
59%
0%
53%
61%
All nutrients comparison - raw data values
Nutrient
DV% diff.
Manganese
5.63mg
0.142mg
239%
Phosphorus
734mg
52mg
97%
Vitamin B1
1.17mg
0.067mg
92%
Selenium
45.2µg
0.4µg
81%
Iron
5.41mg
0.55mg
61%
Magnesium
235mg
29mg
49%
Fiber
15.4g
6.7g
35%
Protein
17.3g
2g
31%
Copper
0.403mg
0.19mg
24%
Zinc
3.11mg
0.64mg
22%
Carbs
66.22g
8.53g
19%
Monounsaturated fat
2.376g
9.799g
19%
Vitamin K
3.2µg
21µg
15%
Fats
7.03g
14.66g
12%
Vitamin C
0mg
10mg
11%
Vitamin E
1.01mg
2.07mg
7%
Vitamin B2
0.22mg
0.13mg
7%
Vitamin B6
0.165mg
0.257mg
7%
Folate
52µg
81µg
7%
Polyunsaturated fat
2.766g
1.816g
6%
Calcium
58mg
12mg
5%
Vitamin B3
0.934mg
1.738mg
5%
Calories
246kcal
160kcal
4%
Saturated fat
1.328g
2.126g
4%
Choline
32.2mg
14.2mg
3%
Potassium
566mg
485mg
2%
Vitamin B5
1.494mg
1.389mg
2%
Vitamin A
0µg
7µg
1%
Protein per 100 calories
7g
1.3g
N/A
Calories per 10 g protein
142kcal
800kcal
N/A
Weight per 100 calories
41g
63g
N/A
Unsaturated / Saturated Fat ratio
3.9
5.5
N/A
Net carbs
50.82g
1.83g
N/A
Sugar
1.45g
0.66g
N/A
Starch
0.11g
0%
Sodium
4mg
7mg
0%
Tryptophan
0.335mg
0.025mg
0%
Threonine
0.502mg
0.073mg
0%
Isoleucine
0.668mg
0.084mg
0%
Leucine
1.374mg
0.143mg
0%
Lysine
0.76mg
0.132mg
0%
Methionine
0.335mg
0.038mg
0%
Phenylalanine
0.908mg
0.097mg
0%
Valine
0.964mg
0.107mg
0%
Histidine
0.41mg
0.049mg
0%
Fructose
0.12g
0%
Omega-3 - ALA
0.111g
N/A
Omega-6 - Gamma-linoleic acid
0.015g
N/A
Macronutrient Comparison
Macronutrient breakdown side-by-side comparison
3
17%
7%
66%
7%
3%
Protein:
17.3 g
Fats:
7.03 g
Carbs:
66.22 g
Water:
6.55 g
Other:
2.9 g
2
2%
15%
9%
73%
Protein:
2 g
Fats:
14.66 g
Carbs:
8.53 g
Water:
73.23 g
Other:
1.58 g
Contains
more
Protein Protein
+765%
Contains
more
Carbs Carbs
+676.3%
Contains
more
Other Other
+83.5%
Contains
more
Fats Fats
+108.5%
Contains
more
Water Water
+1018%
Fat Type Comparison
Fat type breakdown side-by-side comparison
2
21%
37%
43%
Saturated fat:
Sat. Fat
1.328 g
Monounsaturated fat:
Mono. Fat
2.376 g
Polyunsaturated fat:
Poly. Fat
2.766 g
1
15%
71%
13%
Saturated fat:
Sat. Fat
2.126 g
Monounsaturated fat:
Mono. Fat
9.799 g
Polyunsaturated fat:
Poly. Fat
1.816 g
Contains
less
Sat. Fat Saturated fat
-37.5%
Contains
more
Poly. Fat Polyunsaturated fat
+52.3%
Contains
more
Mono. Fat Monounsaturated fat
+312.4%