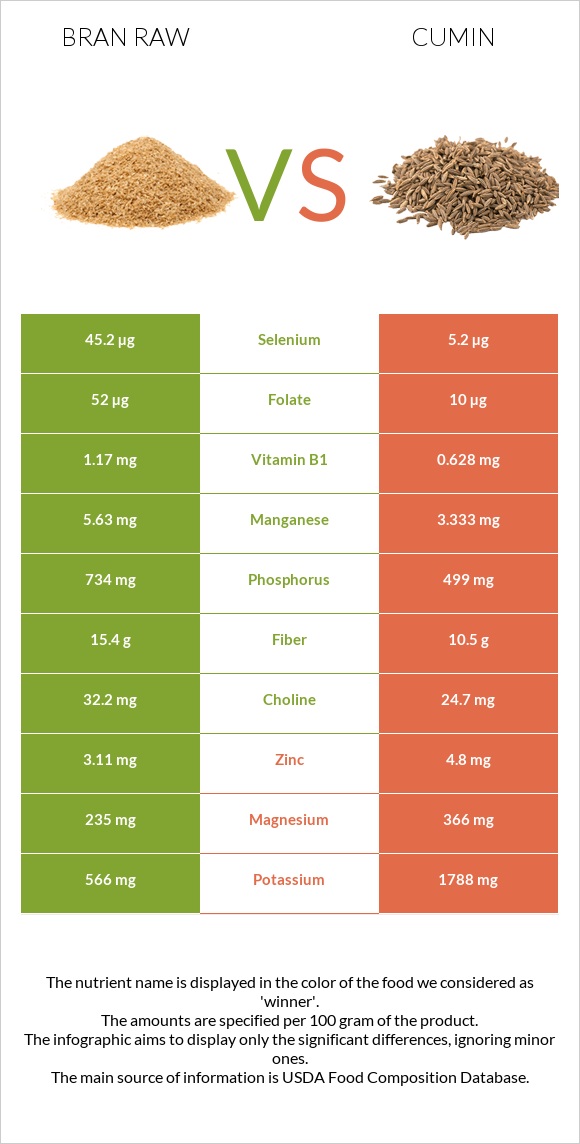
What are the differences between bran raw and cumin? Bran raw is higher in manganese, selenium, vitamin B1, and phosphorus, yet cumin is higher in iron, calcium, copper, potassium, magnesium, and vitamin A. Cumin's daily need coverage for iron is 762% more. Bran raw has 9 times more selenium than cumin. While bran raw has 45.2µg of selenium, cumin has only 5.2µg. The glycemic index of cumin is lower. We used Oat bran, raw and Spices, cumin seed types in this article.
Infographic
Mineral Comparison
Mineral comparison score is based on the number of minerals by which one or the other food is richer. The "coverage" charts below show how much of the daily needs can be covered by 300 grams of the food.
4
100 g
300 g
1 cup - 94g
Magnesium
Magnesium
Calcium
Calcium
Potassium
Potassium
Iron
Iron
Copper
Copper
Zinc
Zinc
Phosphorus
Phosphorus
Sodium
Sodium
Manganese
Manganese
Selenium
Selenium
168%
17%
50%
203%
134%
85%
315%
0.52%
734%
247%
6
100 g
300 g
0.25 tsp, whole - 0.5g 1 tbsp, whole - 6g
Magnesium
Magnesium
Calcium
Calcium
Potassium
Potassium
Iron
Iron
Copper
Copper
Zinc
Zinc
Phosphorus
Phosphorus
Sodium
Sodium
Manganese
Manganese
Selenium
Selenium
261%
279%
158%
2489%
289%
131%
214%
22%
435%
28%
Vitamin Comparison
Vitamin comparison score is based on the number of vitamins by which one or the other food is richer. The "coverage" charts below show how much of the daily needs can be covered by 300 grams of the food.
3
100 g
300 g
1 cup - 94g
Vitamin C
Vit. C
Vitamin D
Vit. D
Vitamin A
Vit. A
Vitamin E
Vit. E
Vitamin B1
Vit. B1
Vitamin B2
Vit. B2
Vitamin B3
Vit. B3
Vitamin B5
Vit. B5
Vitamin B6
Vit. B6
Vitamin B12
Vit. B12
Vitamin K
Vit. K
Folate
Folate
0%
0%
0%
20%
293%
51%
18%
90%
38%
0%
8%
39%
7
100 g
300 g
0.25 tsp, whole - 0.5g 1 tbsp, whole - 6g
Vitamin C
Vit. C
Vitamin D
Vit. D
Vitamin A
Vit. A
Vitamin E
Vit. E
Vitamin B1
Vit. B1
Vitamin B2
Vit. B2
Vitamin B3
Vit. B3
Vitamin B5
Vit. B5
Vitamin B6
Vit. B6
Vitamin B12
Vit. B12
Vitamin K
Vit. K
Folate
Folate
26%
0%
21%
67%
157%
75%
86%
0%
100%
0%
14%
7.5%
All nutrients comparison - raw data values
Nutrient
DV% diff.
Iron
5.41mg
66.36mg
762%
Manganese
5.63mg
3.333mg
100%
Calcium
58mg
931mg
87%
Selenium
45.2µg
5.2µg
73%
Copper
0.403mg
0.867mg
52%
Vitamin B1
1.17mg
0.628mg
45%
Potassium
566mg
1788mg
36%
Phosphorus
734mg
499mg
34%
Magnesium
235mg
366mg
31%
Vitamin B5
1.494mg
30%
Monounsaturated fat
2.376g
14.04g
29%
Fats
7.03g
22.27g
23%
Vitamin B3
0.934mg
4.579mg
23%
Vitamin B6
0.165mg
0.435mg
21%
Fiber
15.4g
10.5g
20%
Zinc
3.11mg
4.8mg
15%
Vitamin E
1.01mg
3.33mg
15%
Folate
52µg
10µg
11%
Vitamin C
0mg
7.7mg
9%
Vitamin B2
0.22mg
0.327mg
8%
Carbs
66.22g
44.24g
7%
Sodium
4mg
168mg
7%
Vitamin A
0µg
64µg
7%
Calories
246kcal
375kcal
6%
Polyunsaturated fat
2.766g
3.279g
3%
Vitamin K
3.2µg
5.4µg
2%
Protein
17.3g
17.81g
1%
Choline
32.2mg
24.7mg
1%
Saturated fat
1.328g
1.535g
1%
Protein per 100 calories
7g
4.7g
N/A
Calories per 10 g protein
142kcal
211kcal
N/A
Weight per 100 calories
41g
27g
N/A
Unsaturated / Saturated Fat ratio
3.9
11
N/A
Net carbs
50.82g
33.74g
N/A
Sugar
1.45g
2.25g
N/A
Tryptophan
0.335mg
0%
Threonine
0.502mg
0%
Isoleucine
0.668mg
0%
Leucine
1.374mg
0%
Lysine
0.76mg
0%
Methionine
0.335mg
0%
Phenylalanine
0.908mg
0%
Valine
0.964mg
0%
Histidine
0.41mg
0%
Macronutrient Comparison
Macronutrient breakdown side-by-side comparison
1
17%
7%
66%
7%
3%
Protein:
17.3 g
Fats:
7.03 g
Carbs:
66.22 g
Water:
6.55 g
Other:
2.9 g
4
18%
22%
44%
8%
8%
Protein:
17.81 g
Fats:
22.27 g
Carbs:
44.24 g
Water:
8.06 g
Other:
7.62 g
Contains
more
Carbs Carbs
+49.7%
Contains
more
Fats Fats
+216.8%
Contains
more
Water Water
+23.1%
Contains
more
Other Other
+162.8%
~equal in
Protein
~17.81g
Fat Type Comparison
Fat type breakdown side-by-side comparison
1
21%
37%
43%
Saturated fat:
Sat. Fat
1.328 g
Monounsaturated fat:
Mono. Fat
2.376 g
Polyunsaturated fat:
Poly. Fat
2.766 g
2
8%
74%
17%
Saturated fat:
Sat. Fat
1.535 g
Monounsaturated fat:
Mono. Fat
14.04 g
Polyunsaturated fat:
Poly. Fat
3.279 g
Contains
less
Sat. Fat Saturated fat
-13.5%
Contains
more
Mono. Fat Monounsaturated fat
+490.9%
Contains
more
Poly. Fat Polyunsaturated fat
+18.5%