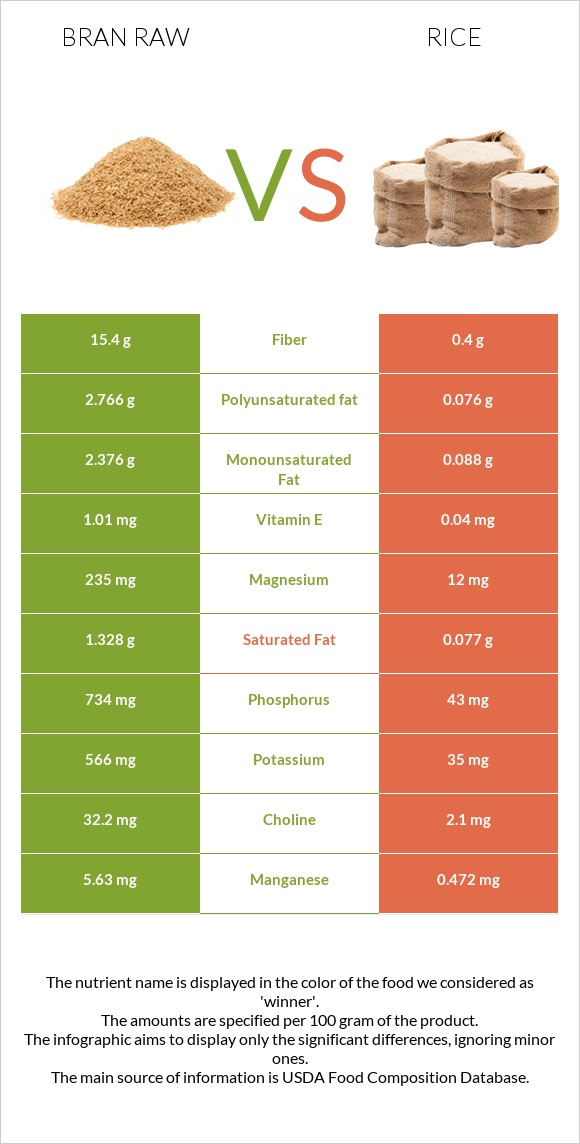
How are bran raw and rice different? Bran raw is higher than rice in manganese, phosphorus, vitamin B1, selenium, fiber, magnesium, iron, copper, zinc, and vitamin B5. Bran raw covers your daily need for manganese, 224% more than rice. Bran raw contains 39 times more fiber than rice. Bran raw contains 15.4g of fiber, while rice contains 0.4g. Oat bran, raw and Rice, white, long-grain, regular, enriched, cooked types were used in this article.
Infographic
Mineral Comparison
Mineral comparison score is based on the number of minerals by which one or the other food is richer. The "coverage" charts below show how much of the daily needs can be covered by 300 grams of the food.
9
100 g
300 g
1 cup - 94g
Magnesium
Magnesium
Calcium
Calcium
Potassium
Potassium
Iron
Iron
Copper
Copper
Zinc
Zinc
Phosphorus
Phosphorus
Sodium
Sodium
Manganese
Manganese
Selenium
Selenium
168%
17%
50%
203%
134%
85%
315%
0.52%
734%
247%
1
100 g
300 g
1 cup - 158g
Magnesium
Magnesium
Calcium
Calcium
Potassium
Potassium
Iron
Iron
Copper
Copper
Zinc
Zinc
Phosphorus
Phosphorus
Sodium
Sodium
Manganese
Manganese
Selenium
Selenium
8.6%
3%
3.1%
45%
23%
13%
18%
0.13%
62%
41%
Vitamin Comparison
Vitamin comparison score is based on the number of vitamins by which one or the other food is richer. The "coverage" charts below show how much of the daily needs can be covered by 300 grams of the food.
6
100 g
300 g
1 cup - 94g
Vitamin C
Vit. C
Vitamin D
Vit. D
Vitamin A
Vit. A
Vitamin E
Vit. E
Vitamin B1
Vit. B1
Vitamin B2
Vit. B2
Vitamin B3
Vit. B3
Vitamin B5
Vit. B5
Vitamin B6
Vit. B6
Vitamin B12
Vit. B12
Vitamin K
Vit. K
Folate
Folate
0%
0%
0%
20%
293%
51%
18%
90%
38%
0%
8%
39%
2
100 g
300 g
1 cup - 158g
Vitamin C
Vit. C
Vitamin D
Vit. D
Vitamin A
Vit. A
Vitamin E
Vit. E
Vitamin B1
Vit. B1
Vitamin B2
Vit. B2
Vitamin B3
Vit. B3
Vitamin B5
Vit. B5
Vitamin B6
Vit. B6
Vitamin B12
Vit. B12
Vitamin K
Vit. K
Folate
Folate
0%
0%
0%
0.8%
41%
3%
28%
23%
21%
0%
0%
44%
All nutrients comparison - raw data values
Nutrient
DV% diff.
Manganese
5.63mg
0.472mg
224%
Phosphorus
734mg
43mg
99%
Vitamin B1
1.17mg
0.163mg
84%
Selenium
45.2µg
7.5µg
69%
Fiber
15.4g
0.4g
60%
Magnesium
235mg
12mg
53%
Iron
5.41mg
1.2mg
53%
Copper
0.403mg
0.069mg
37%
Protein
17.3g
2.69g
29%
Zinc
3.11mg
0.49mg
24%
Vitamin B5
1.494mg
0.39mg
22%
Polyunsaturated fat
2.766g
0.076g
18%
Potassium
566mg
35mg
16%
Vitamin B2
0.22mg
0.013mg
16%
Carbs
66.22g
28.17g
13%
Fats
7.03g
0.28g
10%
Calories
246kcal
130kcal
6%
Vitamin E
1.01mg
0.04mg
6%
Vitamin B6
0.165mg
0.093mg
6%
Saturated fat
1.328g
0.077g
6%
Monounsaturated fat
2.376g
0.088g
6%
Calcium
58mg
10mg
5%
Choline
32.2mg
2.1mg
5%
Vitamin B3
0.934mg
1.476mg
3%
Vitamin K
3.2µg
0µg
3%
Folate
52µg
58µg
2%
Protein per 100 calories
7g
2.1g
N/A
Calories per 10 g protein
142kcal
483kcal
N/A
Weight per 100 calories
41g
77g
N/A
Unsaturated / Saturated Fat ratio
3.9
2.1
N/A
Net carbs
50.82g
27.77g
N/A
Sugar
1.45g
0.05g
N/A
Sodium
4mg
1mg
0%
Tryptophan
0.335mg
0.031mg
0%
Threonine
0.502mg
0.096mg
0%
Isoleucine
0.668mg
0.116mg
0%
Leucine
1.374mg
0.222mg
0%
Lysine
0.76mg
0.097mg
0%
Methionine
0.335mg
0.063mg
0%
Phenylalanine
0.908mg
0.144mg
0%
Valine
0.964mg
0.164mg
0%
Histidine
0.41mg
0.063mg
0%
Macronutrient Comparison
Macronutrient breakdown side-by-side comparison
4
17%
7%
66%
7%
3%
Protein:
17.3 g
Fats:
7.03 g
Carbs:
66.22 g
Water:
6.55 g
Other:
2.9 g
1
3%
28%
68%
Protein:
2.69 g
Fats:
0.28 g
Carbs:
28.17 g
Water:
68.44 g
Other:
0.42 g
Contains
more
Protein Protein
+543.1%
Contains
more
Fats Fats
+2410.7%
Contains
more
Carbs Carbs
+135.1%
Contains
more
Other Other
+590.5%
Contains
more
Water Water
+944.9%
Fat Type Comparison
Fat type breakdown side-by-side comparison
2
21%
37%
43%
Saturated fat:
Sat. Fat
1.328 g
Monounsaturated fat:
Mono. Fat
2.376 g
Polyunsaturated fat:
Poly. Fat
2.766 g
1
32%
37%
32%
Saturated fat:
Sat. Fat
0.077 g
Monounsaturated fat:
Mono. Fat
0.088 g
Polyunsaturated fat:
Poly. Fat
0.076 g
Contains
more
Mono. Fat Monounsaturated fat
+2600%
Contains
more
Poly. Fat Polyunsaturated fat
+3539.5%
Contains
less
Sat. Fat Saturated fat
-94.2%