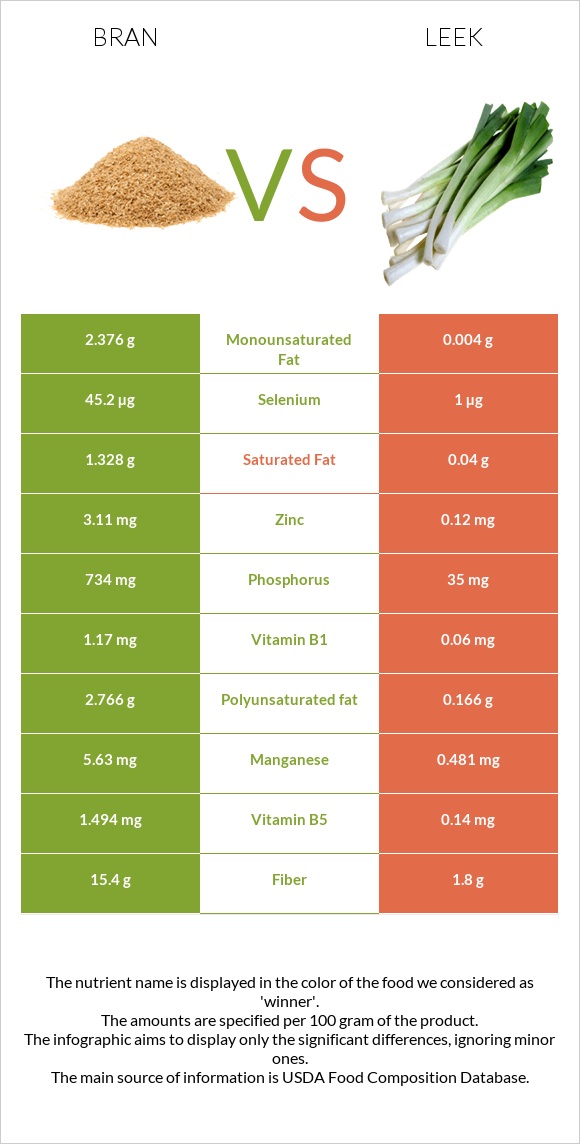
Significant differences between bran and leeks Bran has more manganese, selenium, phosphorus, and vitamin B1; however, leeks are richer in vitamin A, vitamin B6, iron, folate, vitamin C, and copper. Leeks cover your daily vitamin A needs 33% more than bran. Leeks have 8 times less selenium than bran. Bran has 7.7µg of selenium, while leeks have 1µg. Bran has a higher glycemic index. The glycemic index of bran is 56, while the glycemic index of leeks is 32. Specific food types used in this comparison are Oat bran, cooked and Leeks, (bulb and lower leaf-portion), raw .
Infographic
Mineral Comparison
Mineral comparison score is based on the number of minerals by which one or the other food is richer. The "coverage" charts below show how much of the daily needs can be covered by 300 grams of the food.
6
100 g
300 g
1 cup - 219g
Magnesium
Magnesium
Calcium
Calcium
Potassium
Potassium
Iron
Iron
Copper
Copper
Zinc
Zinc
Phosphorus
Phosphorus
Sodium
Sodium
Manganese
Manganese
Selenium
Selenium
29%
3%
8.1%
33%
22%
14%
51%
0.13%
126%
42%
4
100 g
300 g
1 slice - 6g 1 cup - 89g 1 leek - 89g
Magnesium
Magnesium
Calcium
Calcium
Potassium
Potassium
Iron
Iron
Copper
Copper
Zinc
Zinc
Phosphorus
Phosphorus
Sodium
Sodium
Manganese
Manganese
Selenium
Selenium
20%
18%
16%
79%
40%
3.3%
15%
2.6%
63%
5.5%
Vitamin Comparison
Vitamin comparison score is based on the number of vitamins by which one or the other food is richer. The "coverage" charts below show how much of the daily needs can be covered by 300 grams of the food.
3
100 g
300 g
1 cup - 219g
Vitamin C
Vit. C
Vitamin D
Vit. D
Vitamin A
Vit. A
Vitamin E
Vit. E
Vitamin B1
Vit. B1
Vitamin B2
Vit. B2
Vitamin B3
Vit. B3
Vitamin B5
Vit. B5
Vitamin B6
Vit. B6
Vitamin B12
Vit. B12
Vitamin K
Vit. K
Folate
Folate
0%
0%
0%
0%
40%
7.8%
2.7%
13%
5.8%
0%
0%
4.5%
7
100 g
300 g
1 slice - 6g 1 cup - 89g 1 leek - 89g
Vitamin C
Vit. C
Vitamin D
Vit. D
Vitamin A
Vit. A
Vitamin E
Vit. E
Vitamin B1
Vit. B1
Vitamin B2
Vit. B2
Vitamin B3
Vit. B3
Vitamin B5
Vit. B5
Vitamin B6
Vit. B6
Vitamin B12
Vit. B12
Vitamin K
Vit. K
Folate
Folate
40%
0%
28%
18%
15%
6.9%
7.5%
8.4%
54%
0%
118%
48%
All nutrients comparison - raw data values
Nutrient
DV% diff.
Vitamin K
47µg
39%
Manganese
0.964mg
0.481mg
21%
Vitamin B6
0.025mg
0.233mg
16%
Iron
0.88mg
2.1mg
15%
Folate
6µg
64µg
15%
Vitamin C
0mg
12mg
13%
Phosphorus
119mg
35mg
12%
Selenium
7.7µg
1µg
12%
Vitamin A
0µg
83µg
9%
Vitamin B1
0.16mg
0.06mg
8%
Copper
0.066mg
0.12mg
6%
Vitamin E
0.92mg
6%
Calcium
10mg
59mg
5%
Zinc
0.53mg
0.12mg
4%
Protein
3.21g
1.5g
3%
Magnesium
40mg
28mg
3%
Potassium
92mg
180mg
3%
Fiber
2.6g
1.8g
3%
Vitamin B3
0.144mg
0.4mg
2%
Vitamin B5
0.217mg
0.14mg
2%
Choline
9.5mg
2%
Calories
40kcal
61kcal
1%
Fats
0.86g
0.3g
1%
Carbs
11.44g
14.15g
1%
Sodium
1mg
20mg
1%
Saturated fat
0.163g
0.04g
1%
Monounsaturated fat
0.291g
0.004g
1%
Polyunsaturated fat
0.339g
0.166g
1%
Protein per 100 calories
8g
2.5g
N/A
Calories per 10 g protein
125kcal
407kcal
N/A
Weight per 100 calories
250g
164g
N/A
Net carbs
8.84g
12.35g
N/A
Sugar
3.9g
N/A
Vitamin B2
0.034mg
0.03mg
0%
Tryptophan
0.057mg
0.012mg
0%
Threonine
0.086mg
0.063mg
0%
Isoleucine
0.114mg
0.052mg
0%
Leucine
0.235mg
0.096mg
0%
Lysine
0.13mg
0.078mg
0%
Methionine
0.057mg
0.018mg
0%
Phenylalanine
0.155mg
0.055mg
0%
Valine
0.165mg
0.056mg
0%
Histidine
0.07mg
0.025mg
0%
Macronutrient Comparison
Macronutrient breakdown side-by-side comparison
3
3%
11%
84%
Protein:
3.21 g
Fats:
0.86 g
Carbs:
11.44 g
Water:
84 g
Other:
0.49 g
2
14%
83%
Protein:
1.5 g
Fats:
0.3 g
Carbs:
14.15 g
Water:
83 g
Other:
1.05 g
Contains
more
Protein Protein
+114%
Contains
more
Fats Fats
+186.7%
Contains
more
Carbs Carbs
+23.7%
Contains
more
Other Other
+114.3%
Fat Type Comparison
Fat type breakdown side-by-side comparison
2
21%
37%
43%
Saturated fat:
Sat. Fat
0.163 g
Monounsaturated fat:
Mono. Fat
0.291 g
Polyunsaturated fat:
Poly. Fat
0.339 g
1
19%
2%
79%
Saturated fat:
Sat. Fat
0.04 g
Monounsaturated fat:
Mono. Fat
0.004 g
Polyunsaturated fat:
Poly. Fat
0.166 g
Contains
more
Mono. Fat Monounsaturated fat
+7175%
Contains
more
Poly. Fat Polyunsaturated fat
+104.2%
Contains
less
Sat. Fat Saturated fat
-75.5%