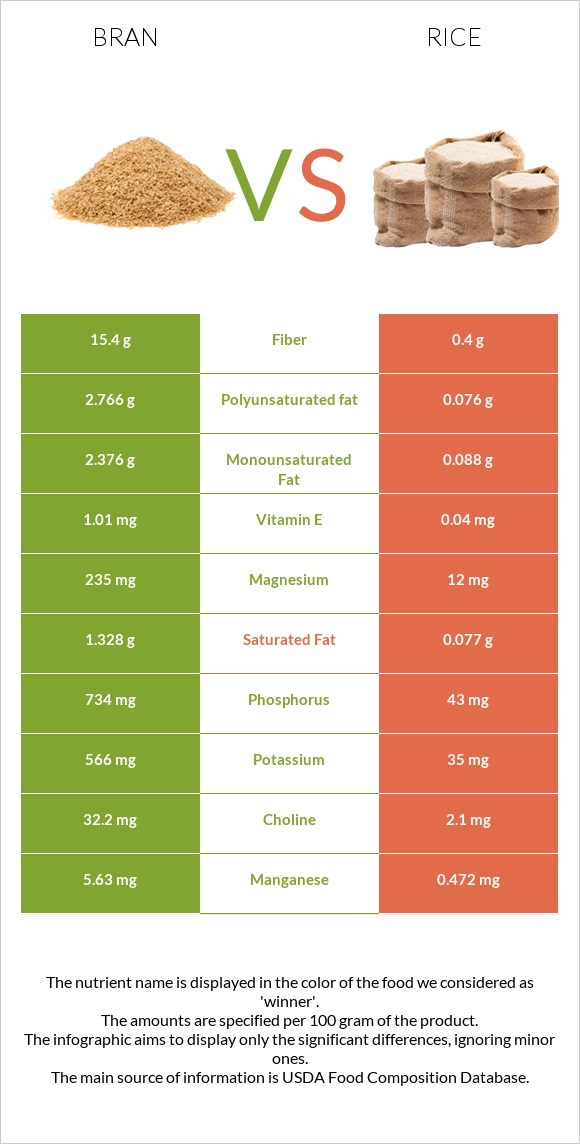
How are bran and rice different? Bran is higher in manganese, phosphorus, fiber, and magnesium; however, rice is richer in folate, vitamin B3, and vitamin B6. Daily need coverage for manganese for bran is 21% higher. Bran contains 7 times more fiber than rice. While bran contains 2.6g of fiber, rice contains only 0.4g. Oat bran, cooked and Rice, white, long-grain, regular, enriched, cooked are the varieties used in this article.
Infographic
Mineral Comparison
Mineral comparison score is based on the number of minerals by which one or the other food is richer. The "coverage" charts below show how much of the daily needs can be covered by 300 grams of the food.
4
100 g
300 g
1 cup - 219g
Magnesium
Magnesium
Calcium
Calcium
Potassium
Potassium
Iron
Iron
Copper
Copper
Zinc
Zinc
Phosphorus
Phosphorus
Sodium
Sodium
Manganese
Manganese
Selenium
Selenium
29%
3%
8.1%
33%
22%
14%
51%
0.13%
126%
42%
1
100 g
300 g
1 cup - 158g
Magnesium
Magnesium
Calcium
Calcium
Potassium
Potassium
Iron
Iron
Copper
Copper
Zinc
Zinc
Phosphorus
Phosphorus
Sodium
Sodium
Manganese
Manganese
Selenium
Selenium
8.6%
3%
3.1%
45%
23%
13%
18%
0.13%
62%
41%
Vitamin Comparison
Vitamin comparison score is based on the number of vitamins by which one or the other food is richer. The "coverage" charts below show how much of the daily needs can be covered by 300 grams of the food.
1
100 g
300 g
1 cup - 219g
Vitamin C
Vit. C
Vitamin D
Vit. D
Vitamin A
Vit. A
Vitamin E
Vit. E
Vitamin B1
Vit. B1
Vitamin B2
Vit. B2
Vitamin B3
Vit. B3
Vitamin B5
Vit. B5
Vitamin B6
Vit. B6
Vitamin B12
Vit. B12
Vitamin K
Vit. K
Folate
Folate
0%
0%
0%
0%
40%
7.8%
2.7%
13%
5.8%
0%
0%
4.5%
5
100 g
300 g
1 cup - 158g
Vitamin C
Vit. C
Vitamin D
Vit. D
Vitamin A
Vit. A
Vitamin E
Vit. E
Vitamin B1
Vit. B1
Vitamin B2
Vit. B2
Vitamin B3
Vit. B3
Vitamin B5
Vit. B5
Vitamin B6
Vit. B6
Vitamin B12
Vit. B12
Vitamin K
Vit. K
Folate
Folate
0%
0%
0%
0.8%
41%
3%
28%
23%
21%
0%
0%
44%
All nutrients comparison - raw data values
Nutrient
DV% diff.
Manganese
0.964mg
0.472mg
21%
Folate
6µg
58µg
13%
Phosphorus
119mg
43mg
11%
Fiber
2.6g
0.4g
9%
Vitamin B3
0.144mg
1.476mg
8%
Magnesium
40mg
12mg
7%
Carbs
11.44g
28.17g
6%
Calories
40kcal
130kcal
5%
Vitamin B6
0.025mg
0.093mg
5%
Iron
0.88mg
1.2mg
4%
Vitamin B5
0.217mg
0.39mg
3%
Potassium
92mg
35mg
2%
Vitamin B2
0.034mg
0.013mg
2%
Polyunsaturated fat
0.339g
0.076g
2%
Protein
3.21g
2.69g
1%
Fats
0.86g
0.28g
1%
Monounsaturated fat
0.291g
0.088g
1%
Protein per 100 calories
8g
2.1g
N/A
Calories per 10 g protein
125kcal
483kcal
N/A
Weight per 100 calories
250g
77g
N/A
Net carbs
8.84g
27.77g
N/A
Calcium
10mg
10mg
0%
Sugar
0.05g
N/A
Copper
0.066mg
0.069mg
0%
Zinc
0.53mg
0.49mg
0%
Sodium
1mg
1mg
0%
Vitamin E
0.04mg
0%
Selenium
7.7µg
7.5µg
0%
Vitamin B1
0.16mg
0.163mg
0%
Choline
2.1mg
0%
Saturated fat
0.163g
0.077g
0%
Tryptophan
0.057mg
0.031mg
0%
Threonine
0.086mg
0.096mg
0%
Isoleucine
0.114mg
0.116mg
0%
Leucine
0.235mg
0.222mg
0%
Lysine
0.13mg
0.097mg
0%
Methionine
0.057mg
0.063mg
0%
Phenylalanine
0.155mg
0.144mg
0%
Valine
0.165mg
0.164mg
0%
Histidine
0.07mg
0.063mg
0%
Macronutrient Comparison
Macronutrient breakdown side-by-side comparison
4
3%
11%
84%
Protein:
3.21 g
Fats:
0.86 g
Carbs:
11.44 g
Water:
84 g
Other:
0.49 g
1
3%
28%
68%
Protein:
2.69 g
Fats:
0.28 g
Carbs:
28.17 g
Water:
68.44 g
Other:
0.42 g
Contains
more
Protein Protein
+19.3%
Contains
more
Fats Fats
+207.1%
Contains
more
Water Water
+22.7%
Contains
more
Other Other
+16.7%
Contains
more
Carbs Carbs
+146.2%
Fat Type Comparison
Fat type breakdown side-by-side comparison
2
21%
37%
43%
Saturated fat:
Sat. Fat
0.163 g
Monounsaturated fat:
Mono. Fat
0.291 g
Polyunsaturated fat:
Poly. Fat
0.339 g
1
32%
37%
32%
Saturated fat:
Sat. Fat
0.077 g
Monounsaturated fat:
Mono. Fat
0.088 g
Polyunsaturated fat:
Poly. Fat
0.076 g
Contains
more
Mono. Fat Monounsaturated fat
+230.7%
Contains
more
Poly. Fat Polyunsaturated fat
+346.1%
Contains
less
Sat. Fat Saturated fat
-52.8%