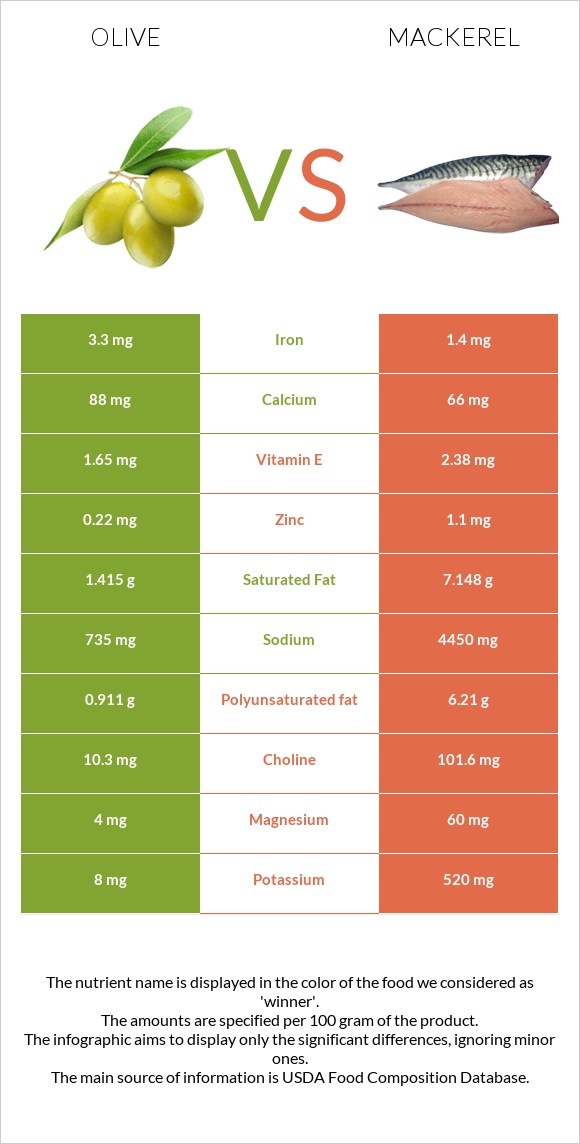
Summary of differences between olive and mackerel Olive has more iron, while mackerel has more vitamin B12, selenium, vitamin D*, phosphorus, vitamin B6, and vitamin B3. Mackerel covers your daily need for vitamin B12, 500% more than olive. Olive contains 2 times more iron than mackerel. While olive contains 3.3mg of iron, mackerel contains only 1.4mg. The amount of saturated fat in olive is lower. These are the specific foods used in this comparison Olives, ripe, canned (small-extra large) and Fish, mackerel, salted .
Infographic
Mineral Comparison
Mineral comparison score is based on the number of minerals by which one or the other food is richer. The "coverage" charts below show how much of the daily needs can be covered by 300 grams of the food.
5
100 g
300 g
1 small - 3.2g 1 large - 4.4g 1 tbsp - 8.4g
Magnesium
Magnesium
Calcium
Calcium
Potassium
Potassium
Iron
Iron
Copper
Copper
Zinc
Zinc
Phosphorus
Phosphorus
Sodium
Sodium
Manganese
Manganese
Selenium
Selenium
2.9%
26%
0.71%
124%
84%
6%
1.3%
96%
2.6%
4.9%
5
100 g
300 g
1 cubic inch, boneless - 17g 1 piece (5-1/2" x 1-1/2" x 1/2") - 80g 1 cup, cooked - 136g
Magnesium
Magnesium
Calcium
Calcium
Potassium
Potassium
Iron
Iron
Copper
Copper
Zinc
Zinc
Phosphorus
Phosphorus
Sodium
Sodium
Manganese
Manganese
Selenium
Selenium
43%
20%
46%
53%
33%
30%
109%
580%
0%
400%
Vitamin Comparison
Vitamin comparison score is based on the number of vitamins by which one or the other food is richer. The "coverage" charts below show how much of the daily needs can be covered by 300 grams of the food.
2
100 g
300 g
1 small - 3.2g 1 large - 4.4g 1 tbsp - 8.4g
Vitamin C
Vit. C
Vitamin D
Vit. D
Vitamin A
Vit. A
Vitamin E
Vit. E
Vitamin B1
Vit. B1
Vitamin B2
Vit. B2
Vitamin B3
Vit. B3
Vitamin B5
Vit. B5
Vitamin B6
Vit. B6
Vitamin B12
Vit. B12
Vitamin K
Vit. K
Folate
Folate
3%
0%
6.7%
33%
0.75%
0%
0.69%
0.9%
2.1%
0%
3.5%
0%
10
100 g
300 g
1 cubic inch, boneless - 17g 1 piece (5-1/2" x 1-1/2" x 1/2") - 80g 1 cup, cooked - 136g
Vitamin C
Vit. C
Vitamin D
Vit. D
Vitamin A
Vit. A
Vitamin E
Vit. E
Vitamin B1
Vit. B1
Vitamin B2
Vit. B2
Vitamin B3
Vit. B3
Vitamin B5
Vit. B5
Vitamin B6
Vit. B6
Vitamin B12
Vit. B12
Vitamin K
Vit. K
Folate
Folate
0%
378%
16%
48%
5%
44%
62%
0%
95%
1500%
20%
11%
All nutrients comparison - raw data values
Nutrient
DV% diff.
Vitamin B12
0µg
12µg
500%
Sodium
735mg
4450mg
162%
Selenium
0.9µg
73.4µg
132%
Vitamin D*
0 IU
1006 IU
126%
Vitamin D
0µg
25.2µg
126%
Phosphorus
3mg
254mg
36%
Protein
0.84g
18.5g
35%
Polyunsaturated fat
0.911g
6.21g
35%
Cholesterol
0mg
95mg
32%
Vitamin B6
0.009mg
0.41mg
31%
Saturated fat
1.415g
7.148g
26%
Iron
3.3mg
1.4mg
24%
Fats
10.68g
25.1g
22%
Vitamin B3
0.037mg
3.3mg
20%
Copper
0.251mg
0.1mg
17%
Choline
10.3mg
101.6mg
17%
Potassium
8mg
520mg
15%
Vitamin B2
0mg
0.19mg
15%
Magnesium
4mg
60mg
13%
Fiber
3.2g
0g
13%
Calories
115kcal
305kcal
10%
Zinc
0.22mg
1.1mg
8%
Vitamin E
1.65mg
2.38mg
5%
Vitamin K
1.4µg
7.8µg
5%
Folate
0µg
15µg
4%
Vitamin A
20µg
47µg
3%
Carbs
6.26g
0g
2%
Calcium
88mg
66mg
2%
Vitamin C
0.9mg
0mg
1%
Manganese
0.02mg
1%
Vitamin B1
0.003mg
0.02mg
1%
Monounsaturated fat
7.888g
8.32g
1%
Protein per 100 calories
0.73g
6.1g
N/A
Calories per 10 g protein
1369kcal
165kcal
N/A
Weight per 100 calories
87g
33g
N/A
Unsaturated / Saturated Fat ratio
6.2
2
N/A
Net carbs
3.06g
0g
N/A
Vitamin B5
0.015mg
0%
Threonine
0.026mg
0%
Isoleucine
0.031mg
0%
Leucine
0.05mg
0%
Lysine
0.032mg
0%
Methionine
0.012mg
0%
Phenylalanine
0.029mg
0%
Valine
0.038mg
0%
Histidine
0.023mg
0%
Omega-3 - EPA
0g
1.619g
N/A
Omega-3 - DHA
0g
2.965g
N/A
Omega-3 - DPA
0g
0.391g
N/A
Macronutrient Comparison
Macronutrient breakdown side-by-side comparison
2
11%
6%
80%
2%
Protein:
0.84 g
Fats:
10.68 g
Carbs:
6.26 g
Water:
79.99 g
Other:
2.23 g
3
19%
25%
43%
13%
Protein:
18.5 g
Fats:
25.1 g
Carbs:
0 g
Water:
43 g
Other:
13.4 g
Contains
more
Carbs Carbs
+∞%
Contains
more
Water Water
+86%
Contains
more
Protein Protein
+2102.4%
Contains
more
Fats Fats
+135%
Contains
more
Other Other
+500.9%
Fat Type Comparison
Fat type breakdown side-by-side comparison
1
14%
77%
9%
Saturated fat:
Sat. Fat
1.415 g
Monounsaturated fat:
Mono. Fat
7.888 g
Polyunsaturated fat:
Poly. Fat
0.911 g
2
33%
38%
29%
Saturated fat:
Sat. Fat
7.148 g
Monounsaturated fat:
Mono. Fat
8.32 g
Polyunsaturated fat:
Poly. Fat
6.21 g
Contains
less
Sat. Fat Saturated fat
-80.2%
Contains
more
Poly. Fat Polyunsaturated fat
+581.7%
~equal in
Monounsaturated fat
~8.32g