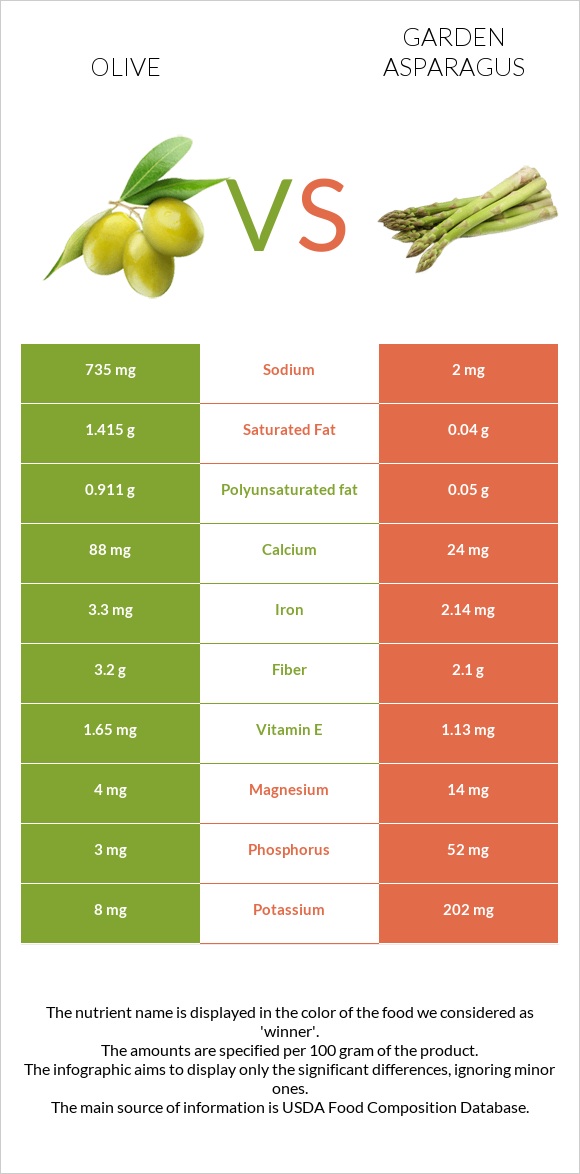
The main differences between olive and asparagus Olive has more iron and copper; however, asparagus has more vitamin K, folate, vitamin B1, vitamin B2, vitamin A, and phosphorus. Daily need coverage for vitamin K for asparagus is 34% higher. Asparagus has 368 times less sodium than olive. Olive has 735mg of sodium, while asparagus has 2mg. Food types used in this article are Olives, ripe, canned (small-extra large) and Asparagus, raw .
Infographic
Mineral Comparison
Mineral comparison score is based on the number of minerals by which one or the other food is richer. The "coverage" charts below show how much of the daily needs can be covered by 300 grams of the food.
3
100 g
300 g
1 small - 3.2g 1 large - 4.4g 1 tbsp - 8.4g
Magnesium
Magnesium
Calcium
Calcium
Potassium
Potassium
Iron
Iron
Copper
Copper
Zinc
Zinc
Phosphorus
Phosphorus
Sodium
Sodium
Manganese
Manganese
Selenium
Selenium
2.9%
26%
0.71%
124%
84%
6%
1.3%
96%
2.6%
4.9%
7
100 g
300 g
1 spear tip (2" long or less) - 3.5g 1 spear, small (5" long or less) - 12g 1 spear, medium (5-1/4" to 7" long) - 16g 1 spear, large (7-1/4" to 8-1/2") - 20g 1 spear, extra large (8-3/4" to 10" long) - 24g 1 cup - 134g
Magnesium
Magnesium
Calcium
Calcium
Potassium
Potassium
Iron
Iron
Copper
Copper
Zinc
Zinc
Phosphorus
Phosphorus
Sodium
Sodium
Manganese
Manganese
Selenium
Selenium
10%
7.2%
18%
80%
63%
15%
22%
0.26%
21%
13%
Vitamin Comparison
Vitamin comparison score is based on the number of vitamins by which one or the other food is richer. The "coverage" charts below show how much of the daily needs can be covered by 300 grams of the food.
1
100 g
300 g
1 small - 3.2g 1 large - 4.4g 1 tbsp - 8.4g
Vitamin C
Vit. C
Vitamin D
Vit. D
Vitamin A
Vit. A
Vitamin E
Vit. E
Vitamin B1
Vit. B1
Vitamin B2
Vit. B2
Vitamin B3
Vit. B3
Vitamin B5
Vit. B5
Vitamin B6
Vit. B6
Vitamin B12
Vit. B12
Vitamin K
Vit. K
Folate
Folate
3%
0%
6.7%
33%
0.75%
0%
0.69%
0.9%
2.1%
0%
3.5%
0%
9
100 g
300 g
1 spear tip (2" long or less) - 3.5g 1 spear, small (5" long or less) - 12g 1 spear, medium (5-1/4" to 7" long) - 16g 1 spear, large (7-1/4" to 8-1/2") - 20g 1 spear, extra large (8-3/4" to 10" long) - 24g 1 cup - 134g
Vitamin C
Vit. C
Vitamin D
Vit. D
Vitamin A
Vit. A
Vitamin E
Vit. E
Vitamin B1
Vit. B1
Vitamin B2
Vit. B2
Vitamin B3
Vit. B3
Vitamin B5
Vit. B5
Vitamin B6
Vit. B6
Vitamin B12
Vit. B12
Vitamin K
Vit. K
Folate
Folate
19%
0%
13%
23%
36%
33%
18%
16%
21%
0%
104%
39%
All nutrients comparison - raw data values
Nutrient
DV% diff.
Vitamin K
1.4µg
41.6µg
34%
Sodium
735mg
2mg
32%
Monounsaturated fat
7.888g
0g
20%
Fats
10.68g
0.12g
16%
Iron
3.3mg
2.14mg
15%
Folate
0µg
52µg
13%
Vitamin B1
0.003mg
0.143mg
12%
Vitamin B2
0mg
0.141mg
11%
Copper
0.251mg
0.189mg
7%
Phosphorus
3mg
52mg
7%
Calcium
88mg
24mg
6%
Potassium
8mg
202mg
6%
Manganese
0.02mg
0.158mg
6%
Vitamin B3
0.037mg
0.978mg
6%
Vitamin B6
0.009mg
0.091mg
6%
Saturated fat
1.415g
0.04g
6%
Polyunsaturated fat
0.911g
0.05g
6%
Calories
115kcal
20kcal
5%
Vitamin C
0.9mg
5.6mg
5%
Vitamin B5
0.015mg
0.274mg
5%
Fiber
3.2g
2.1g
4%
Protein
0.84g
2.2g
3%
Zinc
0.22mg
0.54mg
3%
Vitamin E
1.65mg
1.13mg
3%
Selenium
0.9µg
2.3µg
3%
Magnesium
4mg
14mg
2%
Vitamin A
20µg
38µg
2%
Carbs
6.26g
3.88g
1%
Choline
10.3mg
16mg
1%
Fructose
1g
1%
Protein per 100 calories
0.73g
11g
N/A
Calories per 10 g protein
1369kcal
91kcal
N/A
Weight per 100 calories
87g
500g
N/A
Unsaturated / Saturated Fat ratio
6.2
1.3
N/A
Net carbs
3.06g
1.78g
N/A
Sugar
0g
1.88g
N/A
Tryptophan
0.027mg
0%
Threonine
0.026mg
0.084mg
0%
Isoleucine
0.031mg
0.075mg
0%
Leucine
0.05mg
0.128mg
0%
Lysine
0.032mg
0.104mg
0%
Methionine
0.012mg
0.031mg
0%
Phenylalanine
0.029mg
0.075mg
0%
Valine
0.038mg
0.115mg
0%
Histidine
0.023mg
0.049mg
0%
Macronutrient Comparison
Macronutrient breakdown side-by-side comparison
3
11%
6%
80%
2%
Protein:
0.84 g
Fats:
10.68 g
Carbs:
6.26 g
Water:
79.99 g
Other:
2.23 g
2
2%
4%
93%
Protein:
2.2 g
Fats:
0.12 g
Carbs:
3.88 g
Water:
93.22 g
Other:
0.58 g
Contains
more
Fats Fats
+8800%
Contains
more
Carbs Carbs
+61.3%
Contains
more
Other Other
+284.5%
Contains
more
Protein Protein
+161.9%
Contains
more
Water Water
+16.5%
Fat Type Comparison
Fat type breakdown side-by-side comparison
2
14%
77%
9%
Saturated fat:
Sat. Fat
1.415 g
Monounsaturated fat:
Mono. Fat
7.888 g
Polyunsaturated fat:
Poly. Fat
0.911 g
1
44%
56%
Saturated fat:
Sat. Fat
0.04 g
Monounsaturated fat:
Mono. Fat
0 g
Polyunsaturated fat:
Poly. Fat
0.05 g
Contains
more
Mono. Fat Monounsaturated fat
+∞%
Contains
more
Poly. Fat Polyunsaturated fat
+1722%
Contains
less
Sat. Fat Saturated fat
-97.2%