Parsnip vs. Rutabagas — Health Impact and Nutrition Comparison


Summary
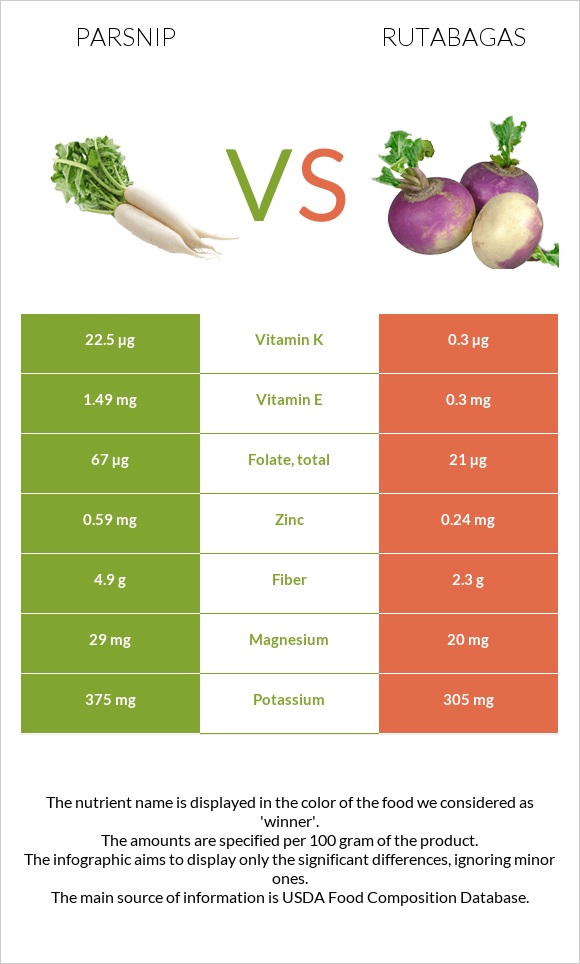
Parsnip is richer in fibers, manganese, copper, iron, phosphorus, potassium, folate, and vitamins K, E, and B5. However, parsnip has a higher glycemic index. In comparison, rutabagas are richer in vitamin C, lower in carbs, and have a lower glycemic index.
Introduction
This article is a comparison between 2 root vegetables; parsnip and rutabagas. We will compare these roots according to their nutritional content and health impacts.
By the end of this article, the reader will understand the difference between parsnips and rutabagas according to the above-listed differences.
Nutrition
We are comparing 100g of parsnip vs. rutabagas in the section below.
Calories
Parsnips and rutabagas are low in calories; relatively, parsnips are higher in calories; however, their caloric content is not of high significance.
Carbs
Parsnip is higher in carbs compared to rutabagas. Parsnip contains 18g of carbs per 100g, whereas rutabagas contain 8.6g.
Glycemic Index
Parsnip and rutabagas are categorized as high glycemic index foods. Parsnip has a higher glycemic index compared to rutabagas. The glycemic index of parsnip is 97, whereas that of rutabagas is 72.
Fiber
Parsnips are richer in fibers compared to rutabagas. They contain twice as much fiber. There are 4.9g of fibers in parsnips compared to rutabagas which contain 2.3g.
Fat and Protein
Their fat and protein content is negligible.
Minerals
Parsnips are richer in manganese, copper, iron, phosphorus, and potassium. Parsnips have an overall richer mineral profile.
In the diagrams below, we can visualize their mineral contents.
Mineral Comparison
Contains
more
MagnesiumMagnesium
+45%
Contains
more
PotassiumPotassium
+23%
Contains
more
IronIron
+34.1%
Contains
more
CopperCopper
+275%
Contains
more
ZincZinc
+145.8%
Contains
more
PhosphorusPhosphorus
+34%
Contains
less
SodiumSodium
-16.7%
Contains
more
ManganeseManganese
+327.5%
Contains
more
SeleniumSelenium
+157.1%
Contains
more
CalciumCalcium
+19.4%
Vitamins
Parsnip is richer in vitamins K, E, B5, and folate. In comparison, rutabagas are richer in vitamin C. It is important to note that parsnips also contain a high amount of vitamin C.
In the diagrams below, we can visualize their vitamin contents.
Vitamin Comparison
Contains
more
Vitamin EVitamin E
+396.7%
Contains
more
Vitamin B2Vitamin B2
+25%
Contains
more
Vitamin B5Vitamin B5
+275%
Contains
more
Vitamin KVitamin K
+7400%
Contains
more
FolateFolate
+219%
Contains
more
Vitamin CVitamin C
+47.1%
Contains
more
Vitamin B6Vitamin B6
+11.1%
Health Impact
In this section, we are comparing their difference in health impacts and not general and common health impacts.
Digestive Health
Parsnips are richer in fibers, which have positive effects on overall gastrointestinal health. It improves digestion and maintains a healthy microbiome in the intestinal tract. (1)
Diabetes
Parsnip is richer in fiber have positive effects on metabolic health. There is better control of insulin sensitivity and overall control of blood sugar levels. (2)
Cancer
Rutabagas contain glucosinolates, which have anticarcinogenic properties. (3)
Immune System
Rutabagas are richer in vitamin C, which is an antioxidant and supports the immune system. (4)
In parallel, parsnips contain vitamin E, which has antioxidative properties. (5)
Manganese Benefits
Parsnip is richer in manganese, which provides several benefits. These benefits include healthy bone formation, metabolism, and the removal of ammonia and metabolites from the central nervous system. (6, 7)
Cardiovascular Health
Rutabagas are a rich source of potassium, which is essential for maintaining healthy blood pressure levels. They also contain glucosinolates, bioactive compounds associated with reduced inflammation and oxidative stress, potentially lowering the risk of cardiovascular diseases (8).
In contrast, parsnips are an excellent source of dietary fiber. This fiber plays a crucial role in reducing LDL (bad cholesterol) by binding to bile acids and promoting their excretion. Additionally, parsnips provide folate, an important nutrient that helps lower homocysteine levels, which is a recognized marker of cardiovascular risk (9, 10).
Both vegetables offer cardiovascular benefits; however, rutabagas may be more effective in regulating blood pressure, while parsnips are particularly useful for managing cholesterol levels. Nonetheless, more research is needed to provide comprehensive and up-to-date evidence on their cardiovascular effects.
References
- https://www.ncbi.nlm.nih.gov/books/NBK559033/
- https://www.ncbi.nlm.nih.gov/pmc/articles/PMC8010426/
- https://www.ncbi.nlm.nih.gov/pmc/articles/PMC7589116/
- https://pubmed.ncbi.nlm.nih.gov/30445746/
- https://pubmed.ncbi.nlm.nih.gov/17173758/
- https://www.ncbi.nlm.nih.gov/pmc/articles/PMC3997530/
- https://pubmed.ncbi.nlm.nih.gov/30855111/
- https://pmc.ncbi.nlm.nih.gov/articles/PMC6029595/
- https://pubmed.ncbi.nlm.nih.gov/9925120/
- https://pubmed.ncbi.nlm.nih.gov/11085827/

Infographic
All nutrients comparison - raw data values
| Nutrient | |
|
DV% diff. |
| Manganese | 0.56mg | 0.131mg | 19% |
| Vitamin K | 22.5µg | 0.3µg | 19% |
| Folate | 67µg | 21µg | 12% |
| Fiber | 4.9g | 2.3g | 10% |
| Copper | 0.12mg | 0.032mg | 10% |
| Vitamin C | 17mg | 25mg | 9% |
| Vitamin B5 | 0.6mg | 0.16mg | 9% |
| Vitamin E | 1.49mg | 0.3mg | 8% |
| Carbs | 17.99g | 8.62g | 3% |
| Zinc | 0.59mg | 0.24mg | 3% |
| Phosphorus | 71mg | 53mg | 3% |
| Choline | 14.1mg | 3% | |
| Calories | 75kcal | 37kcal | 2% |
| Magnesium | 29mg | 20mg | 2% |
| Potassium | 375mg | 305mg | 2% |
| Iron | 0.59mg | 0.44mg | 2% |
| Selenium | 1.8µg | 0.7µg | 2% |
| Fructose | 1.61g | 2% | |
| Calcium | 36mg | 43mg | 1% |
| Vitamin B2 | 0.05mg | 0.04mg | 1% |
| Vitamin B6 | 0.09mg | 0.1mg | 1% |
| Protein | 1.2g | 1.08g | 0% |
| Protein per 100 calories | 1.6g | 2.9g | N/A |
| Calories per 10 g protein | 625kcal | 343kcal | N/A |
| Weight per 100 calories | 133g | 270g | N/A |
| Fats | 0.3g | 0.16g | 0% |
| Net carbs | 13.09g | 6.32g | N/A |
| Sugar | 4.8g | 4.46g | N/A |
| Starch | 0.4g | 0% | |
| Sodium | 10mg | 12mg | 0% |
| Vitamin B1 | 0.09mg | 0.09mg | 0% |
| Vitamin B3 | 0.7mg | 0.7mg | 0% |
| Saturated fat | 0.05g | 0.027g | 0% |
| Monounsaturated fat | 0.112g | 0.025g | 0% |
| Polyunsaturated fat | 0.047g | 0.088g | 0% |
Macronutrient Comparison
| Contains more FatsFats | +87.5% |
| Contains more CarbsCarbs | +108.7% |
| Contains more OtherOther | +38% |
| Contains more WaterWater | +12.4% |
Fat Type Comparison
| Contains more Mono. FatMonounsaturated fat | +348% |
| Contains less Sat. FatSaturated fat | -46% |
| Contains more Poly. FatPolyunsaturated fat | +87.2% |
People also compare


References
All the values for which the sources are not specified explicitly are taken from FDA’s Food Central. The exact link to the food presented on this page can be found below.
- Parsnip - https://fdc.nal.usda.gov/fdc-app.html#/food-details/170417/nutrients
- Rutabagas - https://fdc.nal.usda.gov/fdc-app.html#/food-details/168454/nutrients
All the Daily Values are presented for males aged 31-50, for 2000-calorie diets.