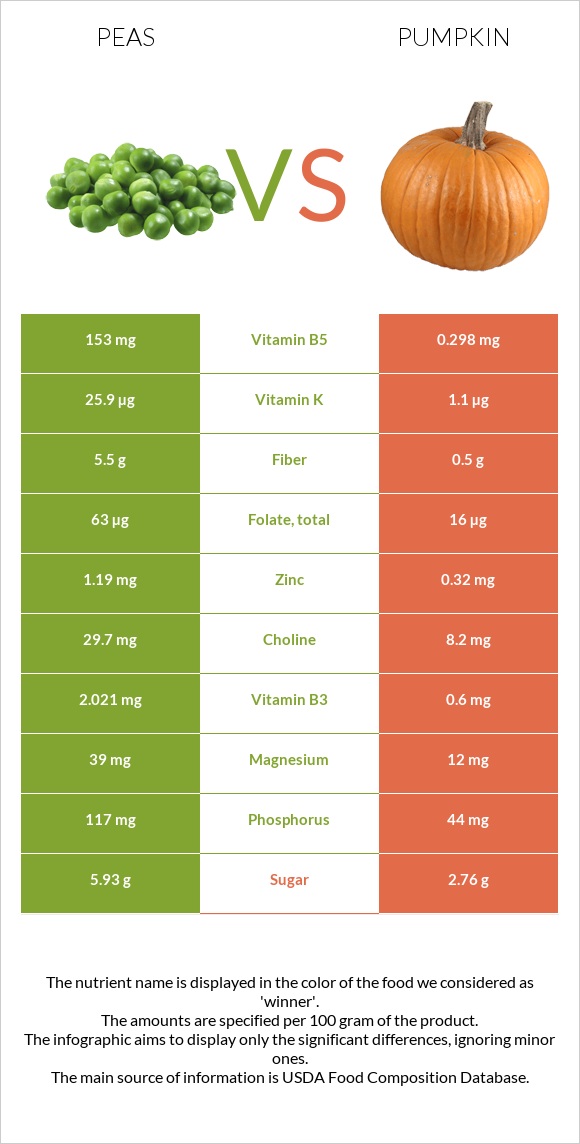
What are the differences between peas and pumpkin? Peas are higher in vitamin B5, vitamin K, fiber, vitamin B1, manganese, vitamin B6, folate, phosphorus, and iron, yet pumpkin is higher in vitamin A. Peas' daily need coverage for vitamin B5 is 3054% more. Peas have 24 times more vitamin K than pumpkin. While peas have 25.9µg of vitamin K, pumpkin has only 1.1µg. We used Peas, green, cooked, boiled, drained, without salt and Pumpkin, raw types in this article.
Infographic
Mineral Comparison
Mineral comparison score is based on the number of minerals by which one or the other food is richer. The "coverage" charts below show how much of the daily needs can be covered by 300 grams of the food.
8
100 g
300 g
1 cup - 160g
Magnesium
Magnesium
Calcium
Calcium
Potassium
Potassium
Iron
Iron
Copper
Copper
Zinc
Zinc
Phosphorus
Phosphorus
Sodium
Sodium
Manganese
Manganese
Selenium
Selenium
28%
8.1%
24%
58%
58%
32%
50%
0.39%
68%
10%
2
100 g
300 g
1 cup (1" cubes) - 116g
Magnesium
Magnesium
Calcium
Calcium
Potassium
Potassium
Iron
Iron
Copper
Copper
Zinc
Zinc
Phosphorus
Phosphorus
Sodium
Sodium
Manganese
Manganese
Selenium
Selenium
8.6%
6.3%
30%
30%
42%
8.7%
19%
0.13%
16%
1.6%
Vitamin Comparison
Vitamin comparison score is based on the number of vitamins by which one or the other food is richer. The "coverage" charts below show how much of the daily needs can be covered by 300 grams of the food.
8
100 g
300 g
1 cup - 160g
Vitamin C
Vit. C
Vitamin D
Vit. D
Vitamin A
Vit. A
Vitamin E
Vit. E
Vitamin B1
Vit. B1
Vitamin B2
Vit. B2
Vitamin B3
Vit. B3
Vitamin B5
Vit. B5
Vitamin B6
Vit. B6
Vitamin B12
Vit. B12
Vitamin K
Vit. K
Folate
Folate
47%
0%
13%
2.8%
65%
34%
38%
9180%
50%
0%
65%
47%
2
100 g
300 g
1 cup (1" cubes) - 116g
Vitamin C
Vit. C
Vitamin D
Vit. D
Vitamin A
Vit. A
Vitamin E
Vit. E
Vitamin B1
Vit. B1
Vitamin B2
Vit. B2
Vitamin B3
Vit. B3
Vitamin B5
Vit. B5
Vitamin B6
Vit. B6
Vitamin B12
Vit. B12
Vitamin K
Vit. K
Folate
Folate
30%
0%
142%
21%
13%
25%
11%
18%
14%
0%
2.8%
12%
All nutrients comparison - raw data values
Nutrient
DV% diff.
Vitamin B5
153mg
0.298mg
3054%
Vitamin A
40µg
426µg
43%
Vitamin K
25.9µg
1.1µg
21%
Fiber
5.5g
0.5g
20%
Manganese
0.525mg
0.125mg
17%
Vitamin B1
0.259mg
0.05mg
17%
Vitamin B6
0.216mg
0.061mg
12%
Folate
63µg
16µg
12%
Phosphorus
117mg
44mg
10%
Protein
5.36g
1g
9%
Iron
1.54mg
0.8mg
9%
Vitamin B3
2.021mg
0.6mg
9%
Zinc
1.19mg
0.32mg
8%
Vitamin C
14.2mg
9mg
6%
Magnesium
39mg
12mg
6%
Vitamin E
0.14mg
1.06mg
6%
Copper
0.173mg
0.127mg
5%
Choline
29.7mg
8.2mg
4%
Calories
84kcal
26kcal
3%
Carbs
15.63g
6.5g
3%
Selenium
1.9µg
0.3µg
3%
Vitamin B2
0.149mg
0.11mg
3%
Potassium
271mg
340mg
2%
Calcium
27mg
21mg
1%
Polyunsaturated fat
0.102g
0.005g
1%
Fructose
0.41g
1%
Protein per 100 calories
6.4g
3.8g
N/A
Calories per 10 g protein
157kcal
260kcal
N/A
Weight per 100 calories
119g
385g
N/A
Fats
0.22g
0.1g
0%
Net carbs
10.13g
6g
N/A
Sugar
5.93g
2.76g
N/A
Sodium
3mg
1mg
0%
Saturated fat
0.039g
0.052g
0%
Monounsaturated fat
0.019g
0.013g
0%
Tryptophan
0.037mg
0.012mg
0%
Threonine
0.201mg
0.029mg
0%
Isoleucine
0.193mg
0.031mg
0%
Leucine
0.32mg
0.046mg
0%
Lysine
0.314mg
0.054mg
0%
Methionine
0.081mg
0.011mg
0%
Phenylalanine
0.198mg
0.032mg
0%
Valine
0.232mg
0.035mg
0%
Histidine
0.105mg
0.016mg
0%
Macronutrient Comparison
Macronutrient breakdown side-by-side comparison
4
5%
16%
78%
Protein:
5.36 g
Fats:
0.22 g
Carbs:
15.63 g
Water:
77.87 g
Other:
0.92 g
1
7%
92%
Protein:
1 g
Fats:
0.1 g
Carbs:
6.5 g
Water:
91.6 g
Other:
0.8 g
Contains
more
Protein Protein
+436%
Contains
more
Fats Fats
+120%
Contains
more
Carbs Carbs
+140.5%
Contains
more
Other Other
+15%
Contains
more
Water Water
+17.6%
Fat Type Comparison
Fat type breakdown side-by-side comparison
3
24%
12%
64%
Saturated fat:
Sat. Fat
0.039 g
Monounsaturated fat:
Mono. Fat
0.019 g
Polyunsaturated fat:
Poly. Fat
0.102 g
0
74%
19%
7%
Saturated fat:
Sat. Fat
0.052 g
Monounsaturated fat:
Mono. Fat
0.013 g
Polyunsaturated fat:
Poly. Fat
0.005 g
Contains
less
Sat. Fat Saturated fat
-25%
Contains
more
Mono. Fat Monounsaturated fat
+46.2%
Contains
more
Poly. Fat Polyunsaturated fat
+1940%