Peanuts, all types, dry-roasted, with salt vs. Nuts, mixed nuts, dry roasted, with peanuts, without salt added — In-Depth Nutrition Comparison
Compare
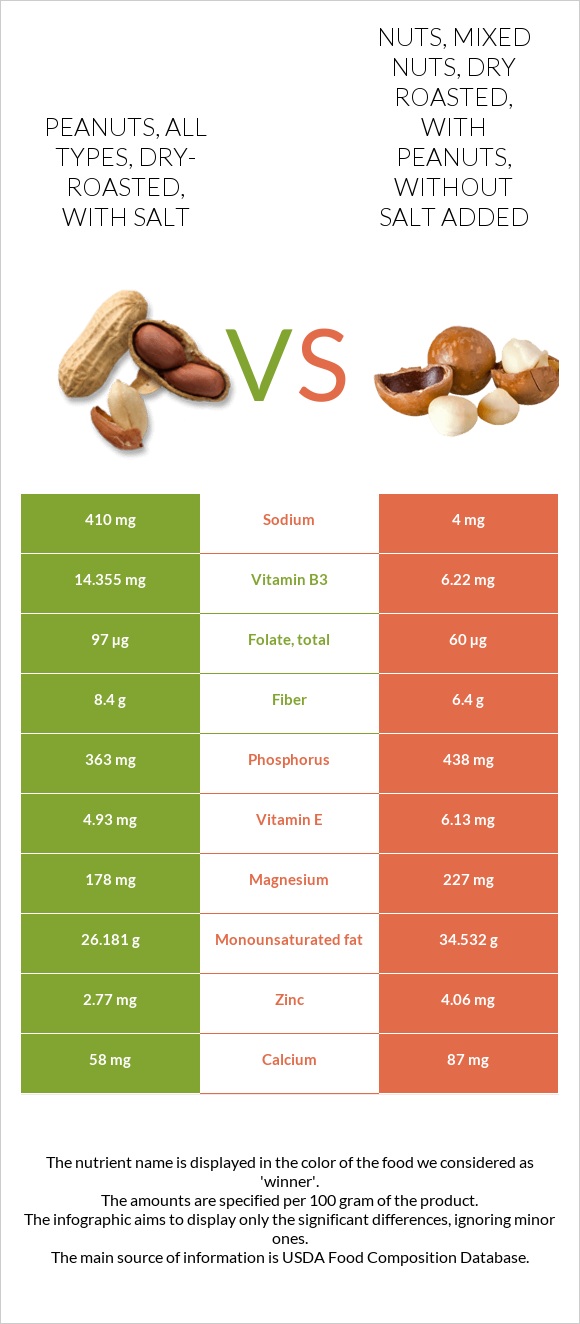
A recap on the differences between peanuts, all types, dry-roasted, with salt and nuts, mixed nuts, dry roasted, with peanuts, without salt added
- Peanuts, all types, dry-roasted, with salt has more vitamin B3; however, nuts, mixed nuts, dry roasted, with peanuts, without salt added is higher in copper, manganese, iron, vitamin B2, vitamin B1, zinc, magnesium, and phosphorus.
- Nuts, mixed nuts, dry roasted, with peanuts, without salt added covers your daily copper needs 121% more than peanuts, all types, dry-roasted, with salt.
- Nuts, mixed nuts, dry roasted, with peanuts, without salt added contains 103 times less sodium than peanuts, all types, dry-roasted, with salt. Peanuts, all types, dry-roasted, with salt contains 410mg of sodium, while nuts, mixed nuts, dry roasted, with peanuts, without salt added contains 4mg.
Food varieties used in this article are Peanuts, all types, dry-roasted, with salt and Nuts, mixed nuts, dry roasted, with peanuts, without salt added.
Infographic
Infographic link
Mineral Comparison
Mineral comparison score is based on the number of minerals by which one or the other food is richer. The "coverage" charts below show how much of the daily needs can be covered by 300 grams of the food.
| Contains more MagnesiumMagnesium | +27.5% |
| Contains more CalciumCalcium | +50% |
| Contains more IronIron | +136.1% |
| Contains more CopperCopper | +255.1% |
| Contains more ZincZinc | +46.6% |
| Contains more PhosphorusPhosphorus | +20.7% |
| Contains less SodiumSodium | -99% |
| Contains more ManganeseManganese | +46.1% |
Vitamin Comparison
Vitamin comparison score is based on the number of vitamins by which one or the other food is richer. The "coverage" charts below show how much of the daily needs can be covered by 300 grams of the food.
| Contains more Vitamin B3Vitamin B3 | +130.8% |
| Contains more Vitamin B5Vitamin B5 | +∞% |
| Contains more Vitamin B6Vitamin B6 | +29.4% |
| Contains more FolateFolate | +61.7% |
| Contains more Vitamin CVitamin C | +∞% |
| Contains more Vitamin EVitamin E | +24.3% |
| Contains more Vitamin B1Vitamin B1 | +97.4% |
| Contains more Vitamin B2Vitamin B2 | +103% |
| Contains more Vitamin KVitamin K | +∞% |
All nutrients comparison - raw data values
| Nutrient |  |
 |
DV% diff. |
| Copper | 0.428mg | 1.52mg | 121% |
| Vitamin B3 | 14.355mg | 6.22mg | 51% |
| Manganese | 1.786mg | 2.61mg | 36% |
| Iron | 1.58mg | 3.73mg | 27% |
| Monounsaturated fat | 26.181g | 34.532g | 21% |
| Vitamin B5 | 1.011mg | 20% | |
| Sodium | 410mg | 4mg | 18% |
| Vitamin B2 | 0.197mg | 0.4mg | 16% |
| Magnesium | 178mg | 227mg | 12% |
| Zinc | 2.77mg | 4.06mg | 12% |
| Vitamin B1 | 0.152mg | 0.3mg | 12% |
| Phosphorus | 363mg | 438mg | 11% |
| Protein | 24.35g | 19.5g | 10% |
| Vitamin K | 0µg | 12µg | 10% |
| Folate | 97µg | 60µg | 9% |
| Fiber | 8.4g | 6.4g | 8% |
| Vitamin E | 4.93mg | 6.13mg | 8% |
| Vitamin B6 | 0.466mg | 0.36mg | 8% |
| Fats | 49.66g | 53.5g | 6% |
| Calcium | 58mg | 87mg | 3% |
| Calories | 587kcal | 607kcal | 1% |
| Vitamin C | 0mg | 0.8mg | 1% |
| Starch | 4.39g | 7.2g | 1% |
| Choline | 64.6mg | 59.2mg | 1% |
| Saturated fat | 7.723g | 8.01g | 1% |
| Polyunsaturated fat | 9.773g | 9.858g | 1% |
| Net carbs | 12.86g | 16.02g | N/A |
| Carbs | 21.26g | 22.42g | 0% |
| Potassium | 634mg | 643mg | 0% |
| Sugar | 4.9g | 5g | N/A |
| Selenium | 9.3µg | 9.3µg | 0% |
| Trans fat | 0.027g | 0.033g | N/A |
| Tryptophan | 0.23mg | 0.222mg | 0% |
| Threonine | 0.811mg | 0.673mg | 0% |
| Isoleucine | 0.833mg | 0.746mg | 0% |
| Leucine | 1.535mg | 1.374mg | 0% |
| Lysine | 0.85mg | 0.742mg | 0% |
| Methionine | 0.291mg | 0.26mg | 0% |
| Phenylalanine | 1.227mg | 1mg | 0% |
| Valine | 0.993mg | 0.941mg | 0% |
| Histidine | 0.599mg | 0.505mg | 0% |
| Omega-3 - EPA | 0g | 0.009g | N/A |
| Omega-3 - ALA | 0.025g | 0.082g | N/A |
| Omega-3 - Eicosatrienoic acid | 0.011g | 0g | N/A |
| Omega-6 - Eicosadienoic acid | 0.004g | 0.004g | N/A |
| Omega-6 - Linoleic acid | 9.694g | 9.74g | N/A |
Macronutrient Comparison
Macronutrient breakdown side-by-side comparison
Protein:
24.35 g
Fats:
49.66 g
Carbs:
21.26 g
Water:
1.81 g
Other:
2.92 g
Protein:
19.5 g
Fats:
53.5 g
Carbs:
22.42 g
Water:
2.13 g
Other:
2.45 g
| Contains more ProteinProtein | +24.9% |
| Contains more OtherOther | +19.2% |
| Contains more WaterWater | +17.7% |
~equal in
Fats
~53.5g
~equal in
Carbs
~22.42g
Fat Type Comparison
Fat type breakdown side-by-side comparison
Saturated fat:
Sat. Fat
7.723 g
Monounsaturated fat:
Mono. Fat
26.181 g
Polyunsaturated fat:
Poly. Fat
9.773 g
Saturated fat:
Sat. Fat
8.01 g
Monounsaturated fat:
Mono. Fat
34.532 g
Polyunsaturated fat:
Poly. Fat
9.858 g
| Contains more Mono. FatMonounsaturated fat | +31.9% |
~equal in
Saturated fat
~8.01g
~equal in
Polyunsaturated fat
~9.858g
Carbohydrate type comparison
Carbohydrate type breakdown side-by-side comparison
Starch:
4.39 g
Sucrose:
4.9 g
Glucose:
0 g
Fructose:
0 g
Lactose:
0 g
Maltose:
0 g
Galactose:
0 g
Starch:
7.2 g
Sucrose:
5 g
Glucose:
0 g
Fructose:
0 g
Lactose:
0 g
Maltose:
0 g
Galactose:
0 g
| Contains more StarchStarch | +64% |
~equal in
Sucrose
~5g
~equal in
Glucose
~0g
~equal in
Fructose
~0g
~equal in
Lactose
~0g
~equal in
Maltose
~0g
~equal in
Galactose
~0g